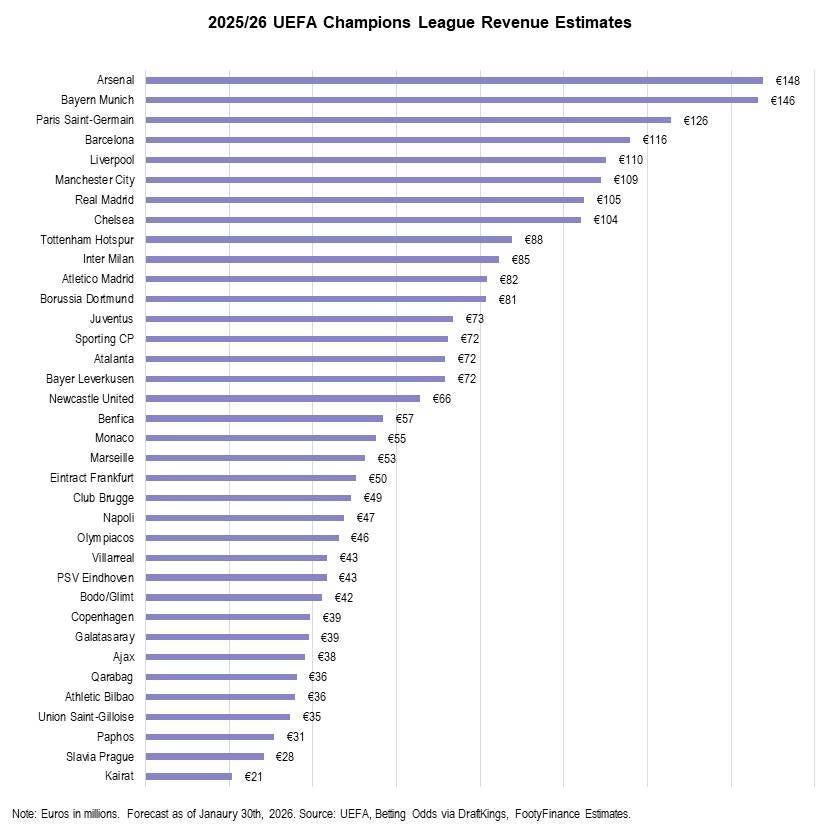
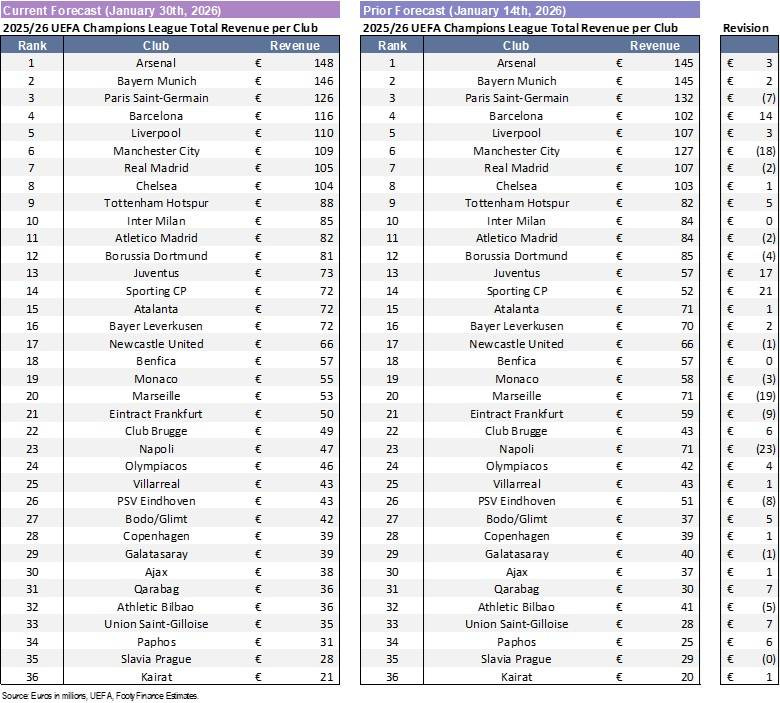
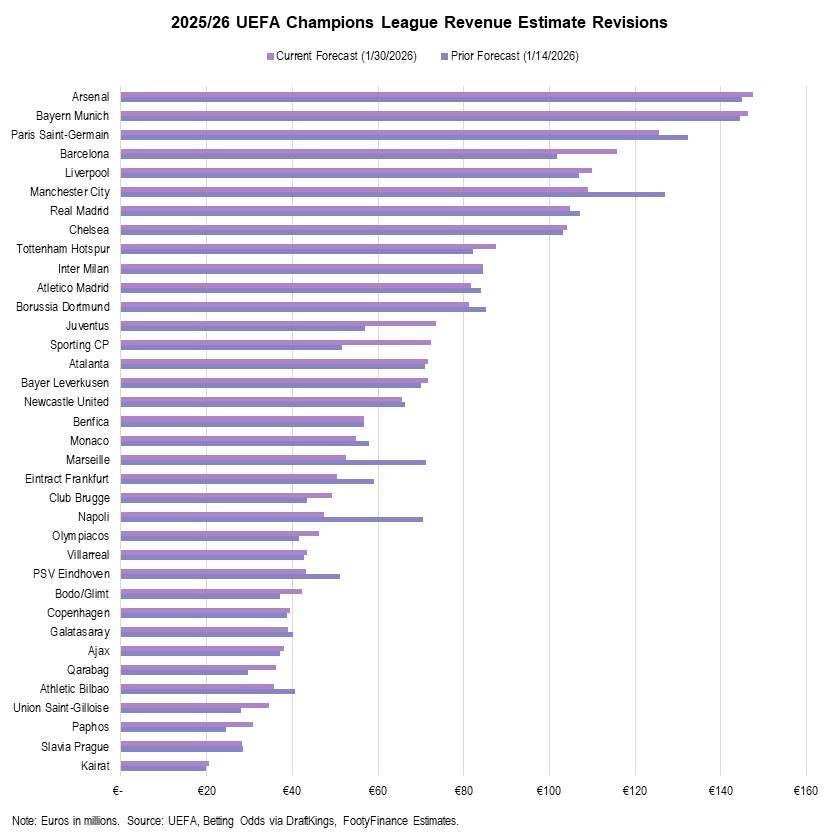
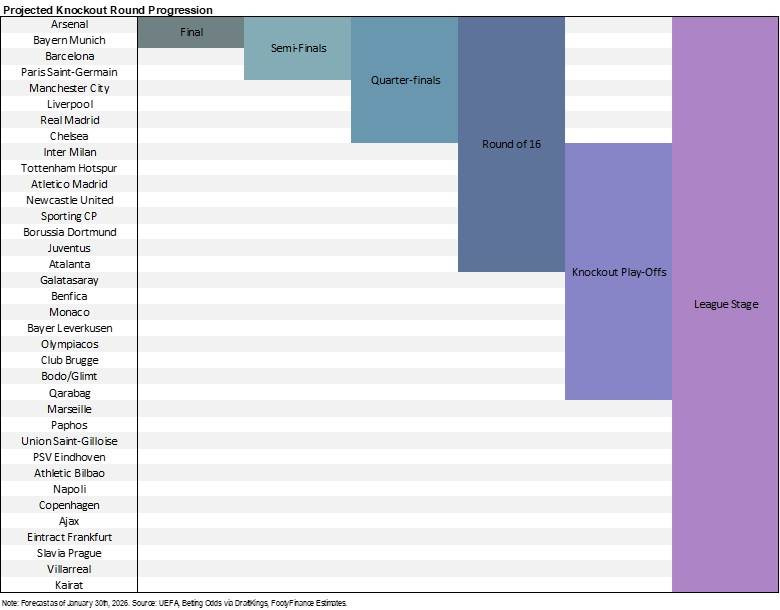
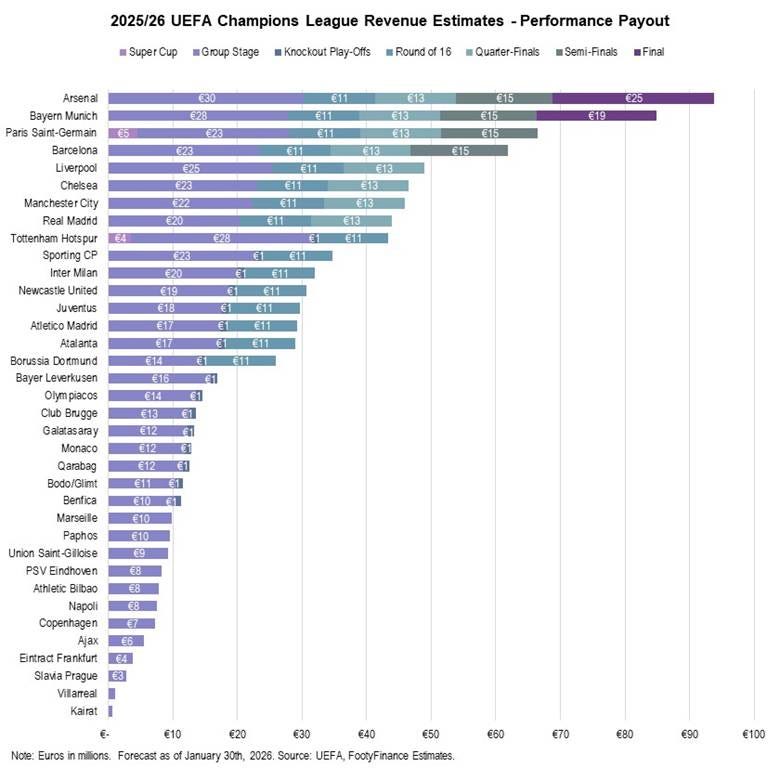
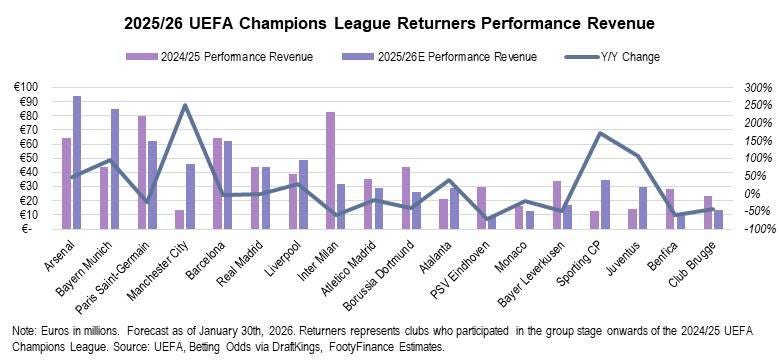
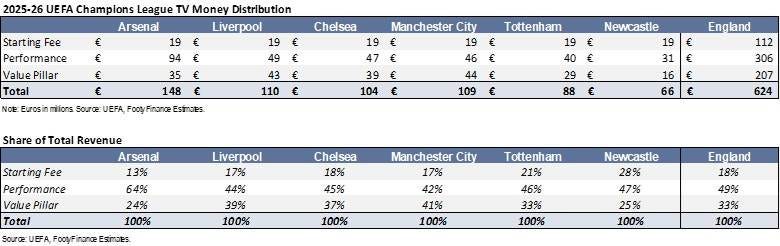
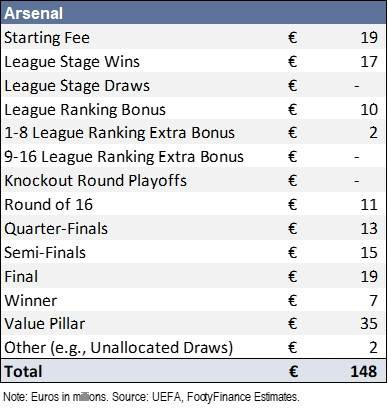
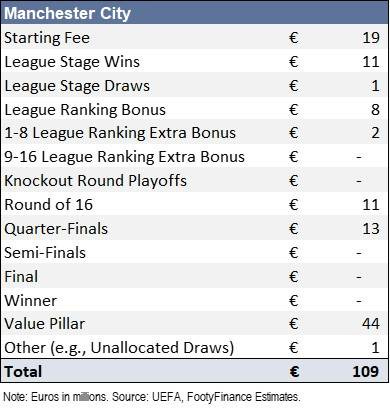
Key Message: This report provides an updated 2025/26 UEFA Champions League TV revenue model following completion of the league stage earlier this week. The initial January 14th revenue forecast and guide to distribution methodology can be found here. Arsenal remains the clear favorite to win the competition and therefore garner the highest revenue at €148mm (up from €145mm prior estimate). Largest upward revisions vs. prior model are at Sporting CP (+€21mm), Juventus (+€17mm), and Barcelona (+€14mm). Sporting CP and Juventus benefitted from better league stage performance than expected and are now forecasted to reach the round of 16 (vs. knockout playoffs previously). Barcelona primarily benefitted from model now forecasting the club to reach the semi-finals of the competition (vs. quarter finals previously). Largest downward revisions are at Napoli (-€23mm), Marseille (-€19mm), and Manchester City (-€18mm). Napoli and Marseille failed to exit the league stage compared to prior forecast that called for both reaching the round of 16. Softer Manchester City outlook is driven by a run to the quarter-finals (vs. semi-finals finish in prior model). Starting fee and value pillar revenue estimates for each club are unchanged – only the performance component. Full detail on revisions and updated forecasts provided within.
Updated Forecast
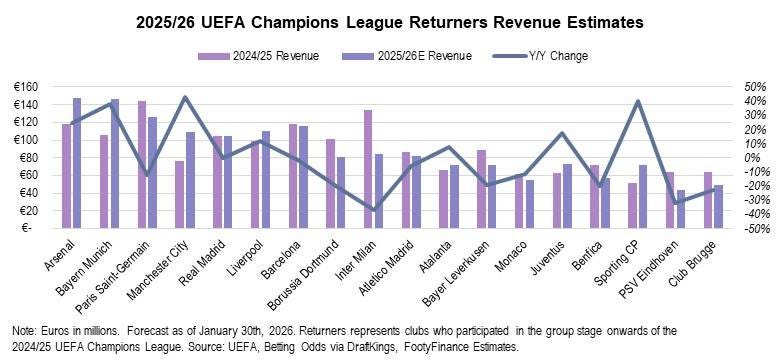
Revision Detail
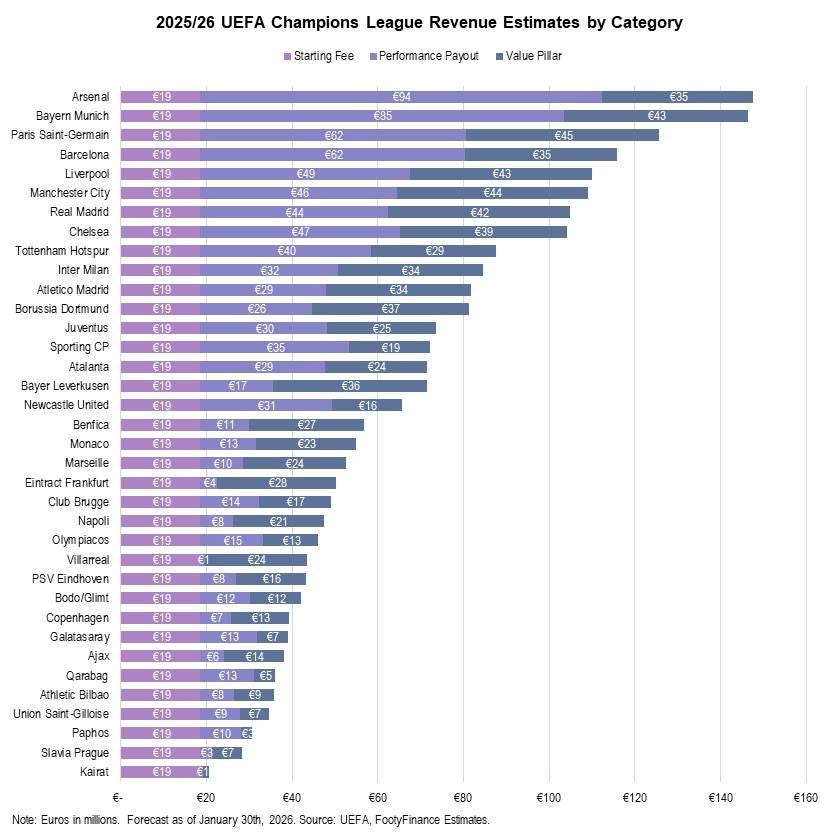
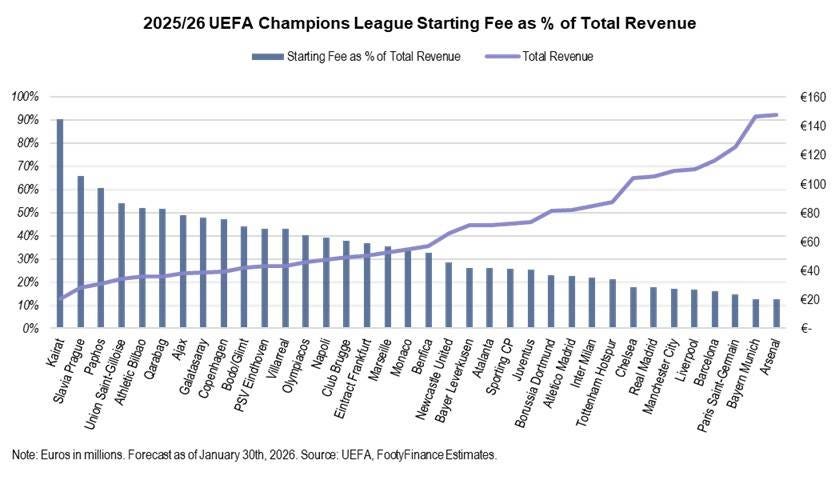
Revenue Breakdown by Category
- Start Fee
- €19mm per club
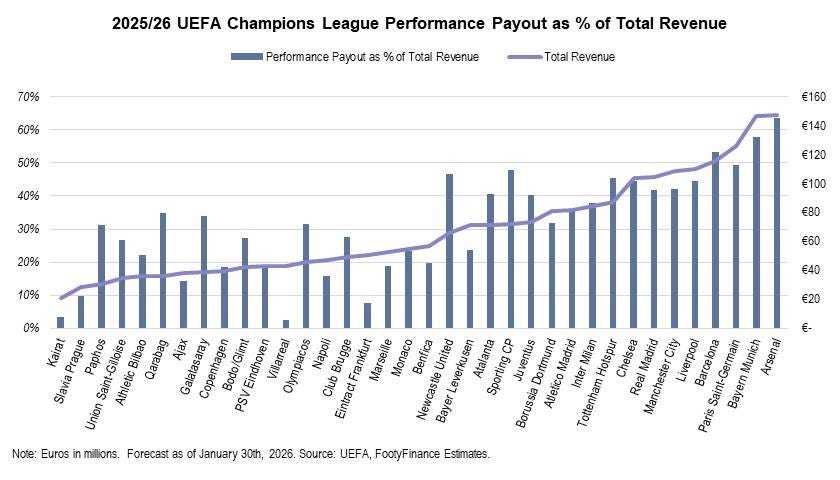
- Performance Payout
- Based on league stage and knockout round win/loss performance
- Payout amounts detailed in “Performance Payout” section of the appendix
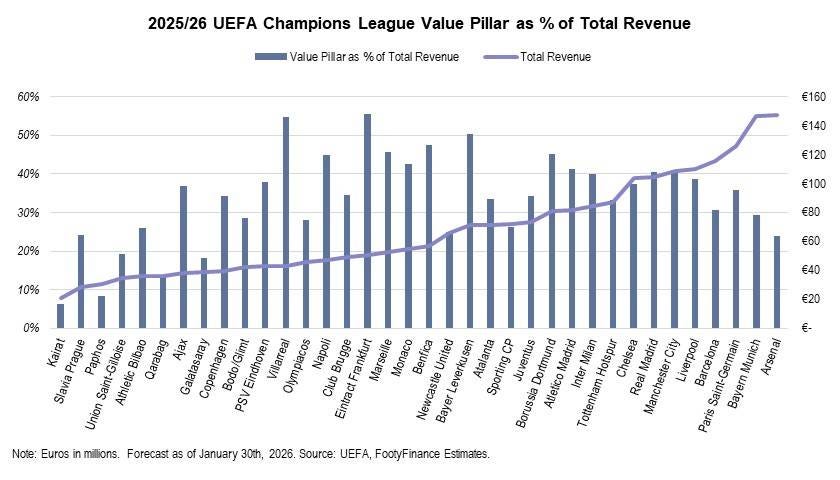
- Value Pillar
- Combines country’s TV market value with individual UEFA club coefficients
- Further detailed in “Value Pillar” section below
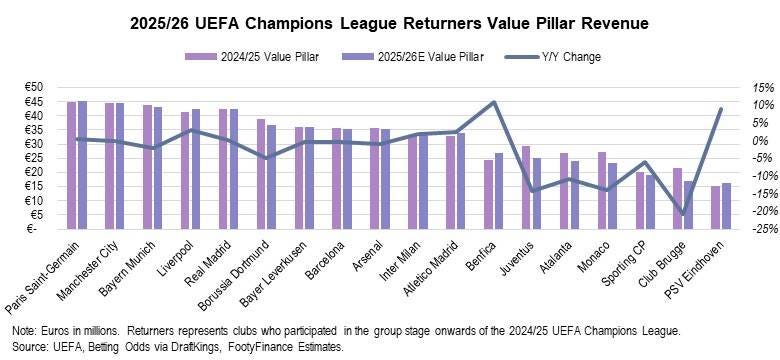
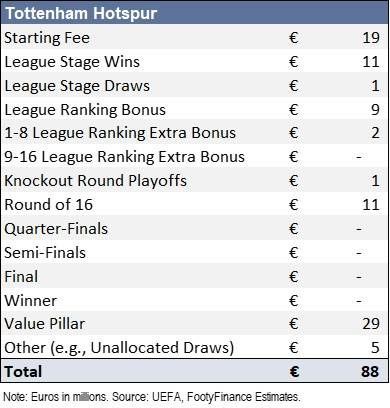
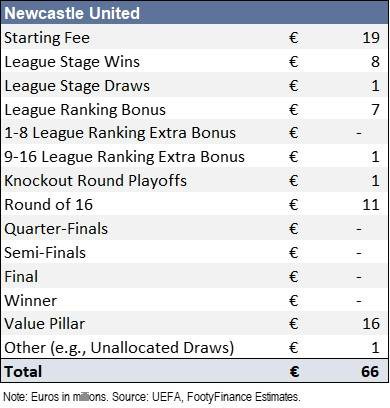
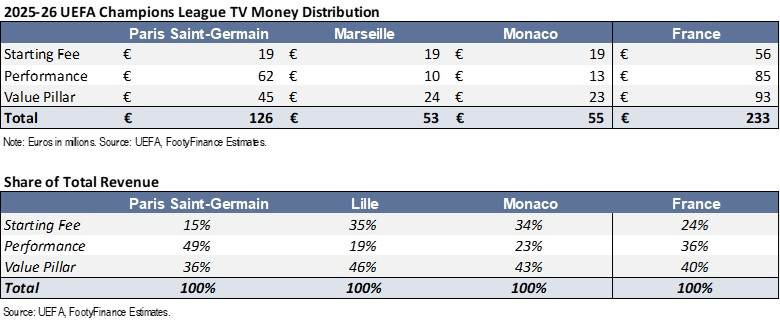
Starting fee and value pillar estimates for all clubs are unchanged. Updated performance payout outlook reflects actual league stage performance and forecasted knockout round performance (via betting odds).
Performance Payout
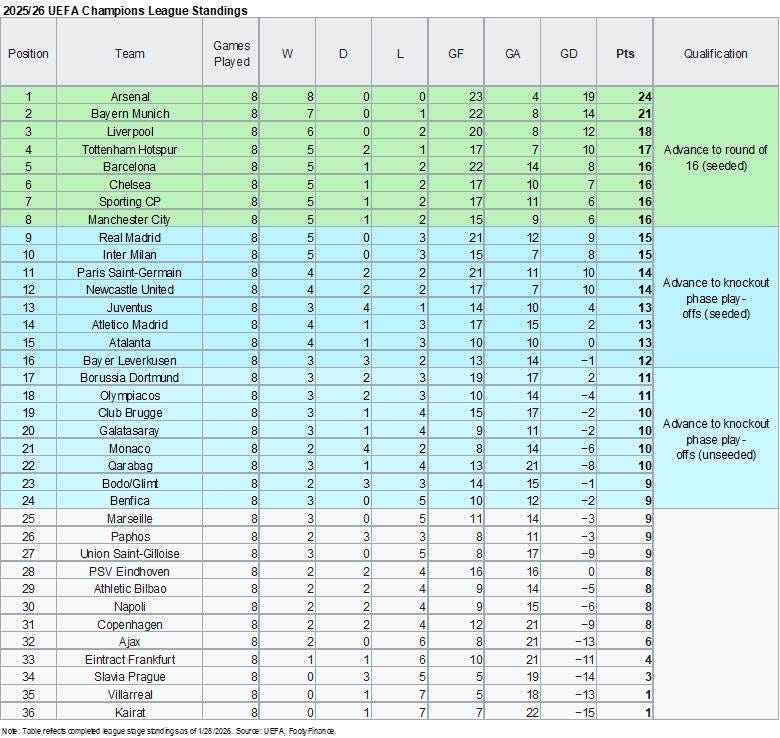
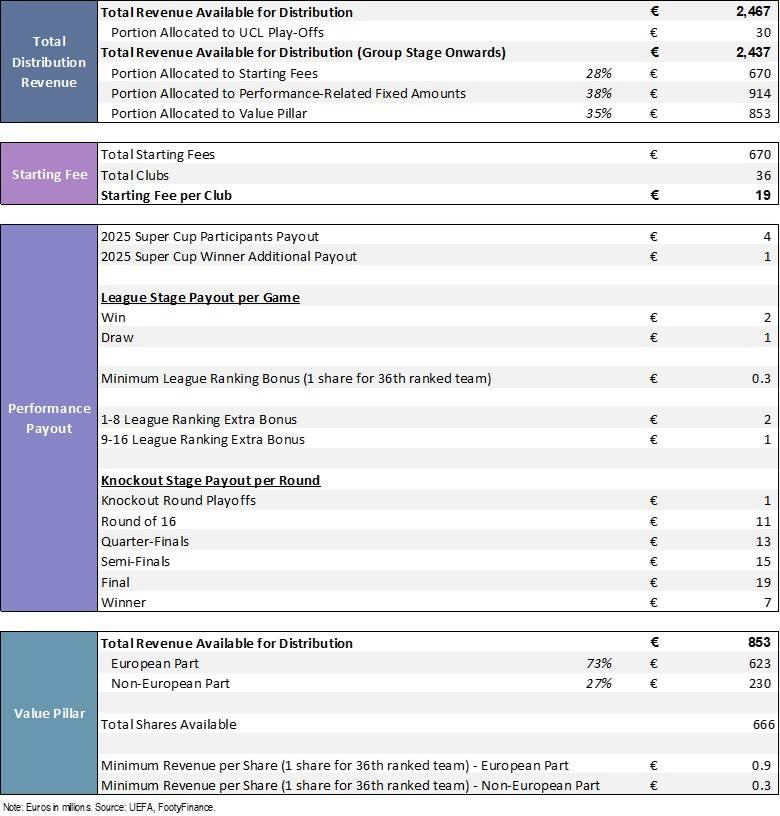
The UEFA Champions League performance payout distributes revenue to each club based on 1) win/draw/loss record in the league stage, and 2) progression in the knockout stage.
League stage calculations are based on actual results (see table below) with knockout round forecast based on current betting odds to win the competition. The top two teams make the final, top four make the semi-finals, top eight make the quarter-finals, etc. Estimates will be updated as each round finishes and as betting odds change.
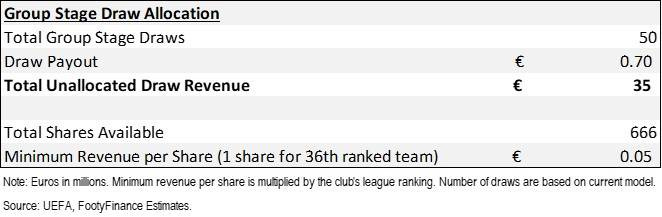
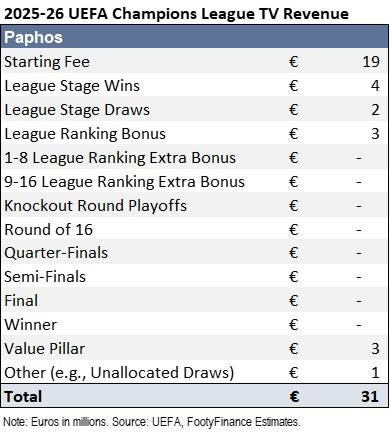
Note that each draw in the league stage adds to a pool of unallocated performance revenue (difference between win payout and draw payout). This unallocated draw revenue is allocated to each team in the league stage based on final position in the table. The last place team receives one “share” of this unallocated draw revenue (equivalent to €0.04mm), while the first place team receives 36 shares (equivalent to €1.36mm). There were 50 total draws in the 2025/26 league stage.
Value Pillar
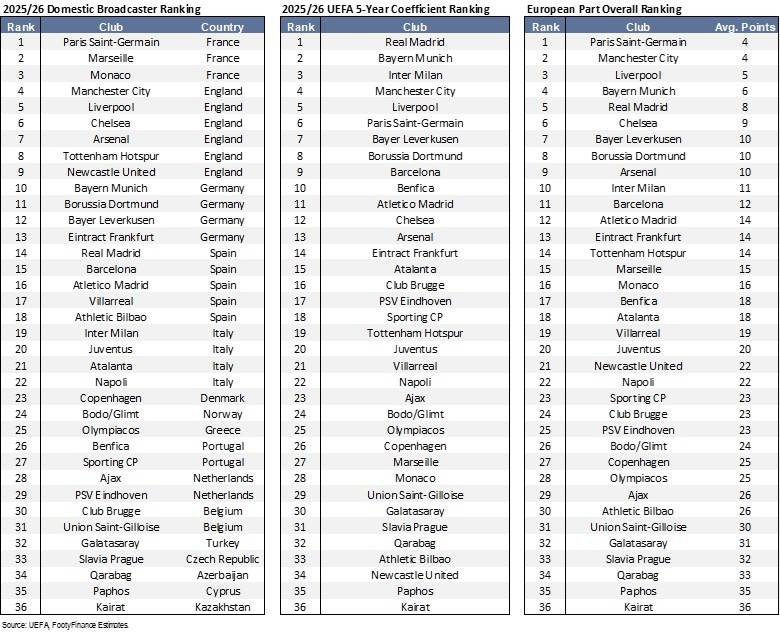
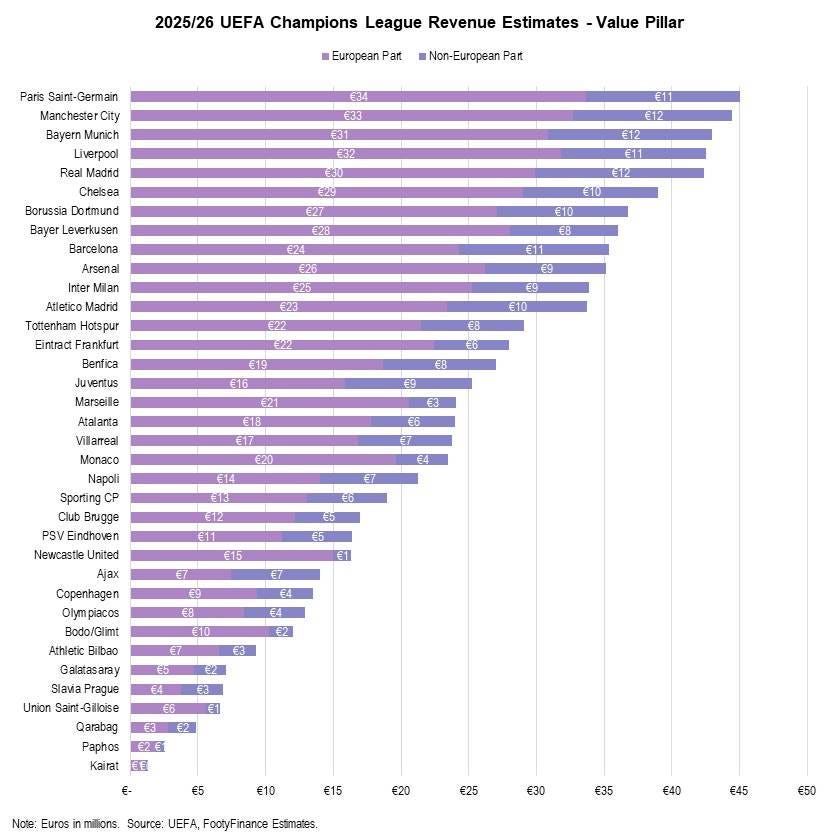
The UEFA Champions League value pillar combines a country’s TV market value with individual club coefficients. The distribution is split into a European and Non-European part with the division being 73%/27%, respectively, for the 2025/26 season.
- European Part
- Two separate rankings (media market value and UEFA five-year coefficient)
- Media market rankings are based on domestic broadcasters’ contribution to overall media revenue
- Within each country, clubs are ranked by a point total based on participation in the league phase of UEFA competitions over the previous five seasons
- 3 points for UCL, 2 points for UEL,1 point for UECL
- Media market rankings are estimated using historical TV revenue disclosed in the UEFA European Club Finance and Investment Landscape reports (most recent is for the 23/24 season – link)
- For the 2025/26 season I rank France, England, Germany, Spain, and Italy, respectively, as the top five markets
- Separate ranking for each club based on five-year UEFA coefficient at start of the season
- Overall European Part ranking based on average ranking (out of 36) of media market value and five-year coefficient (lower the better)
- As detailed in the appendix, the lowest ranking receives €0.9mm, while highest receives €33.7mm (€0.9mm * 36)
- Non-European Part
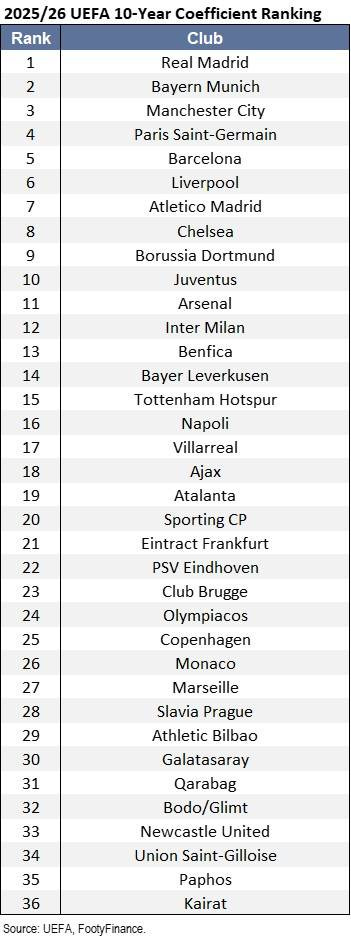
- Based on the ten-year UEFA coefficient ranking
- Lowest ranking receives €0.3mm, while highest receives €12.4mm (€0.3mm * 36)
The European and Non-European parts are added together to form total value pillar revenue.
Appendix:
Revenue Payout Structure
*All forecasts below as of January 30th, 2026*
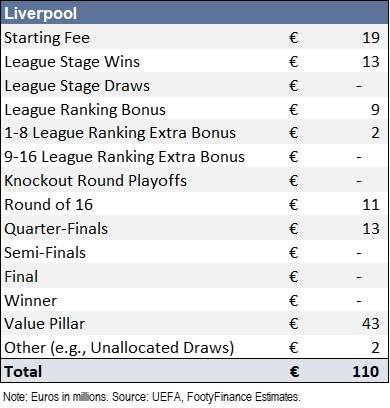
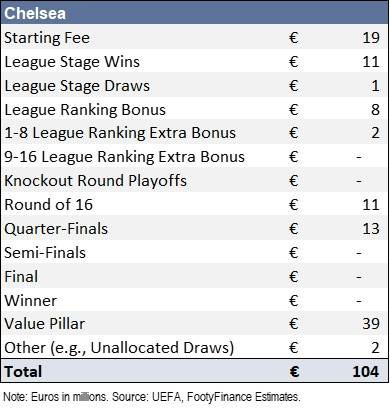
Revenue by Club – England
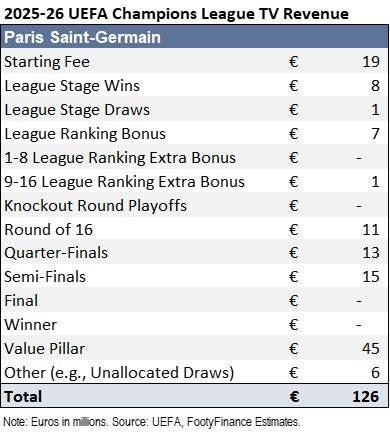
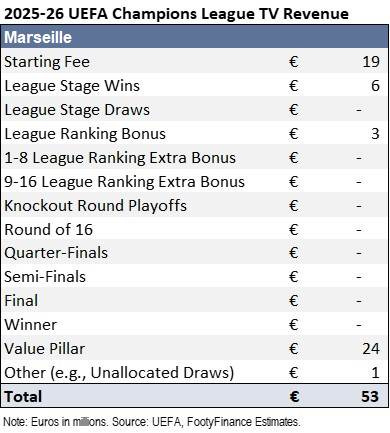
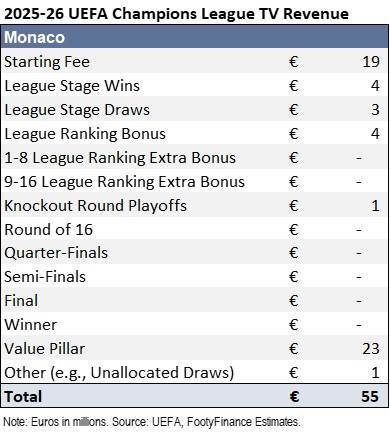
Revenue by Club – France
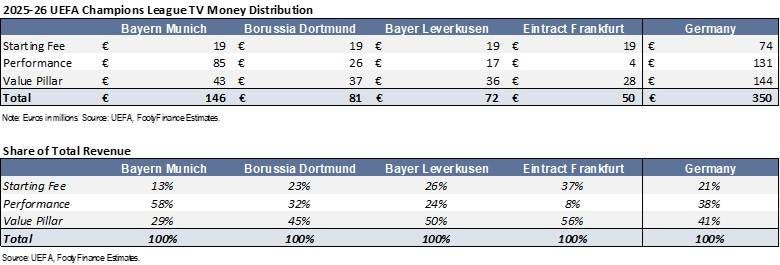
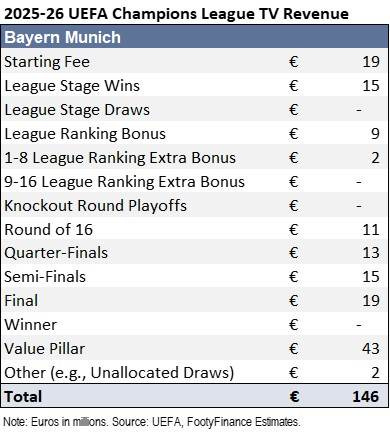
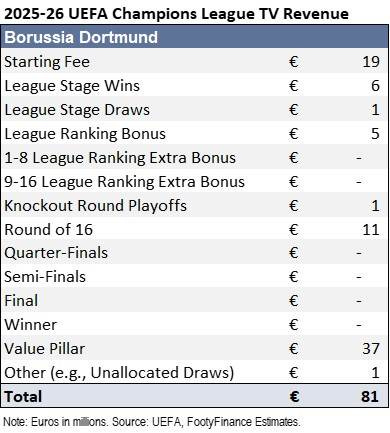
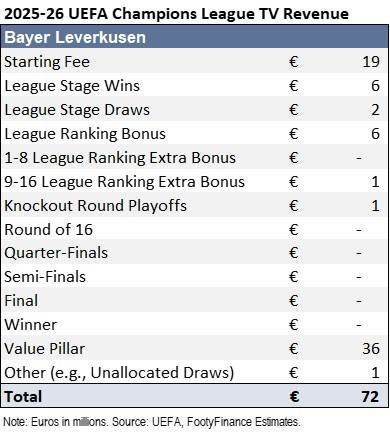
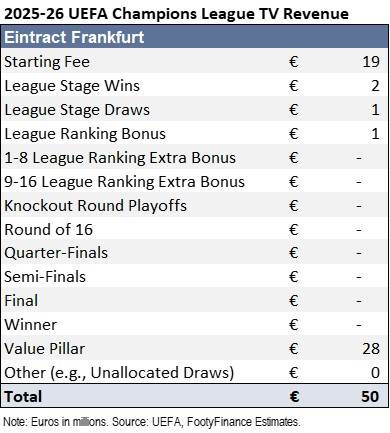
Revenue by Club – Germany
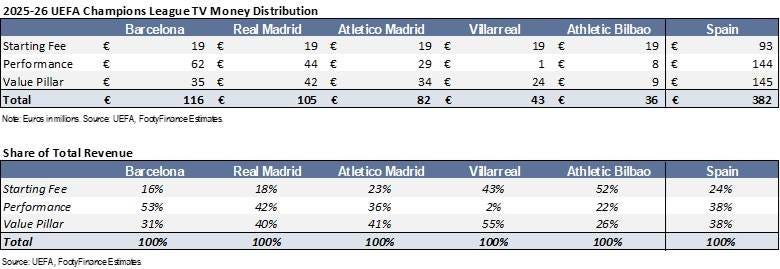
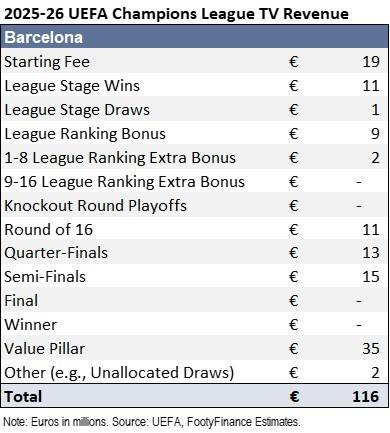
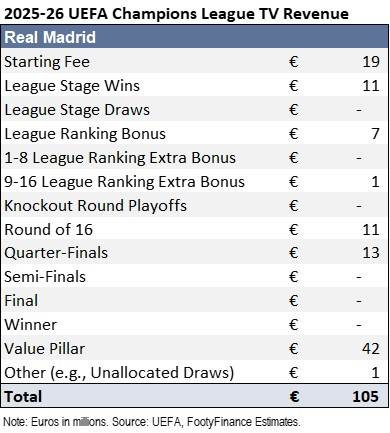
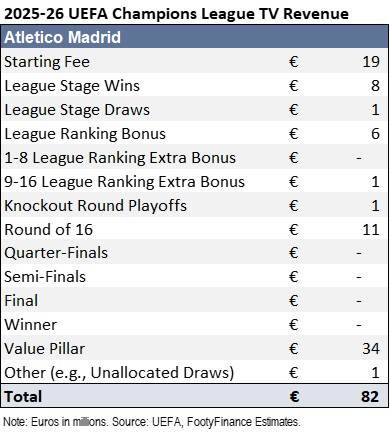
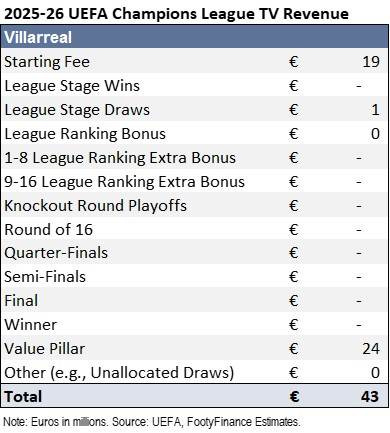
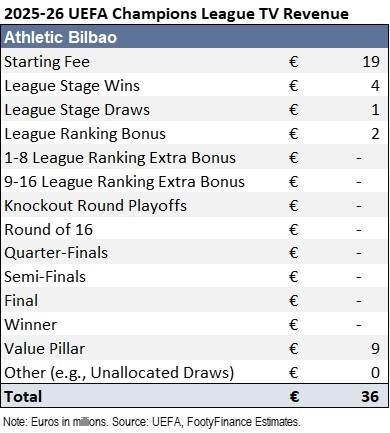
Revenue by Club – Spain
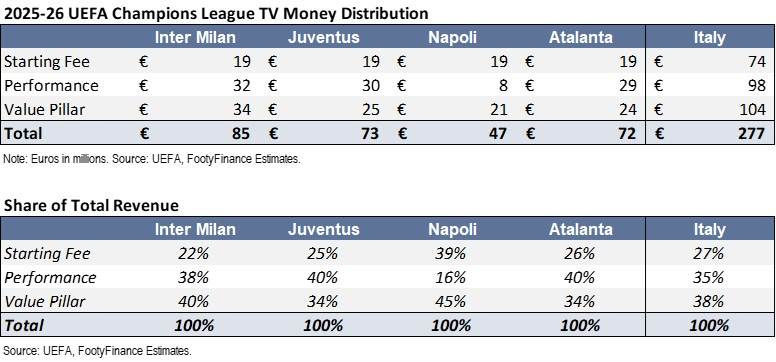
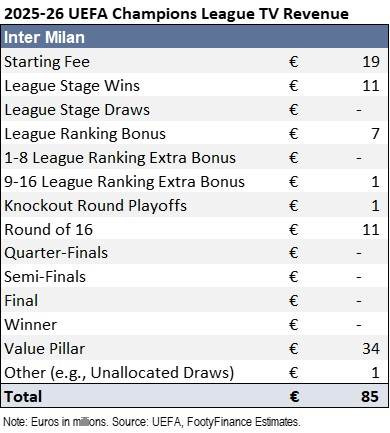
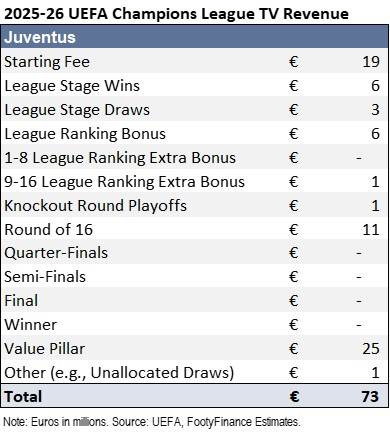
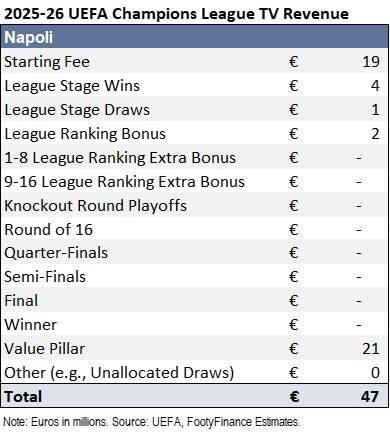
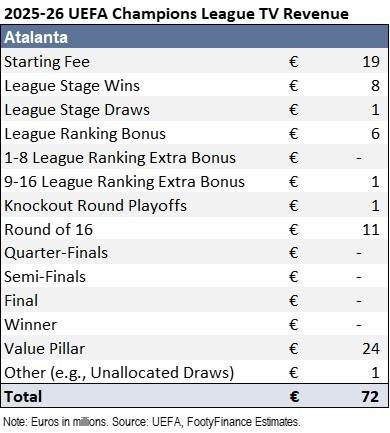
Revenue by Club – Italy
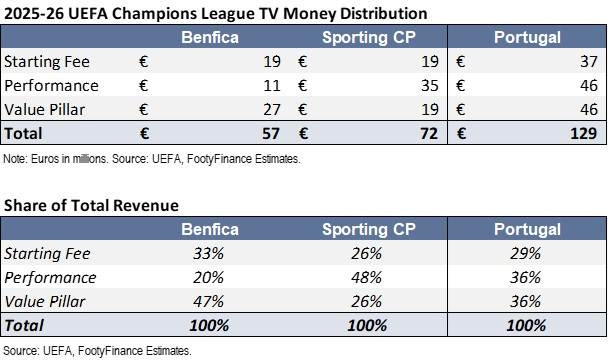
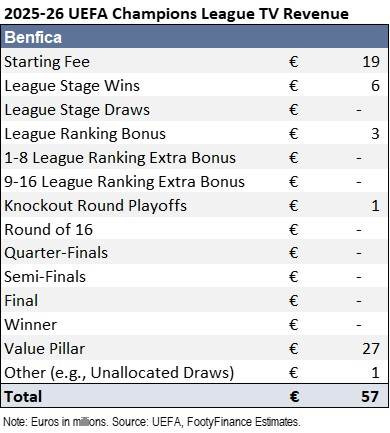
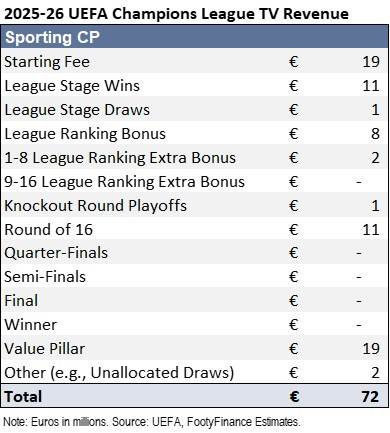
Revenue by Club – Portugal
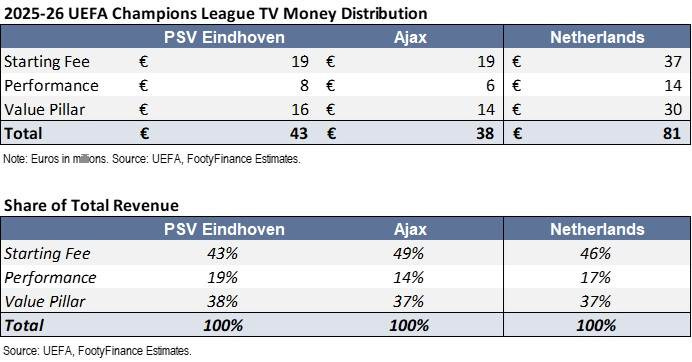
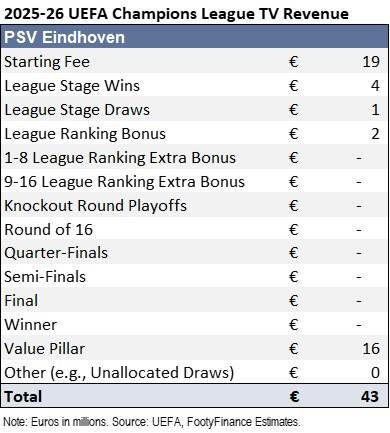
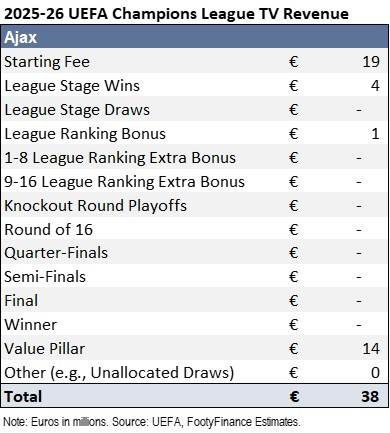
Revenue by Club – Netherlands
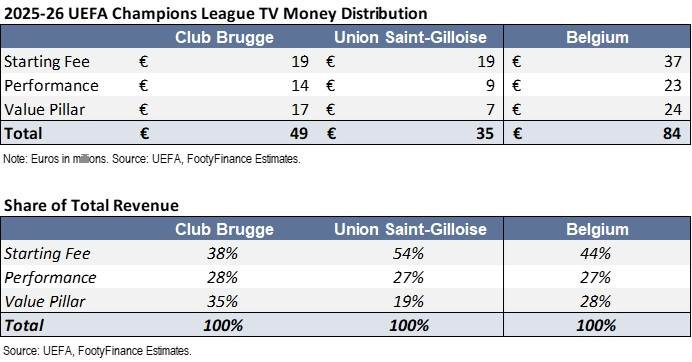
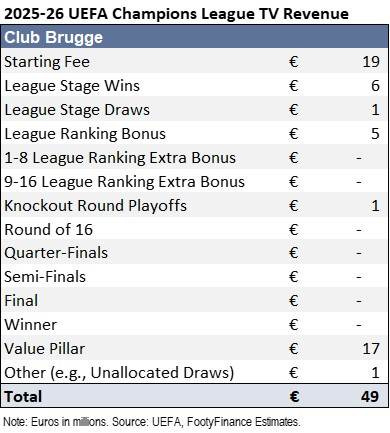
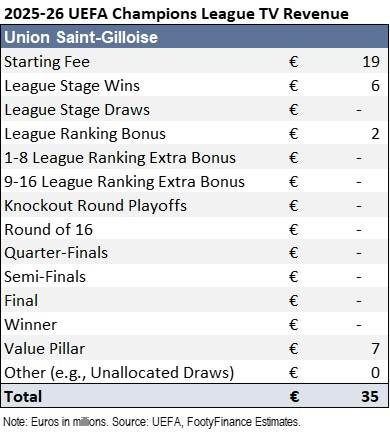
Revenue by Club – Belgium
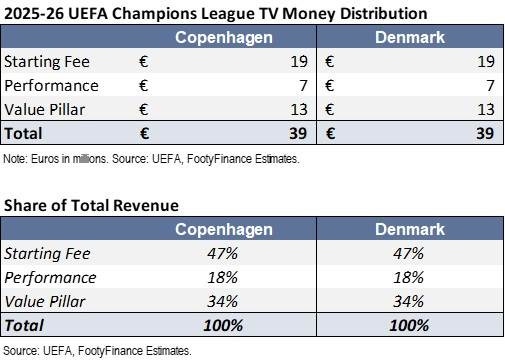
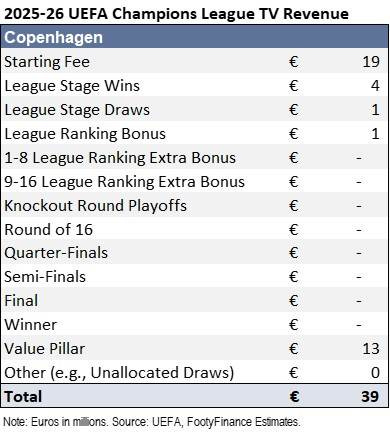
Revenue by Club – Denmark
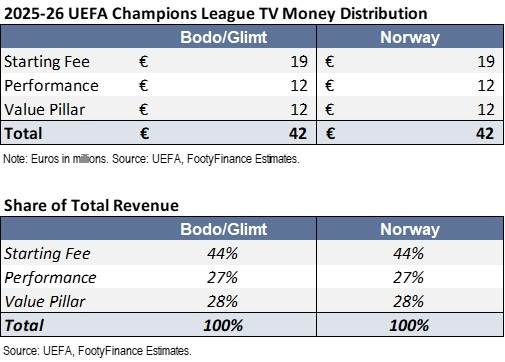
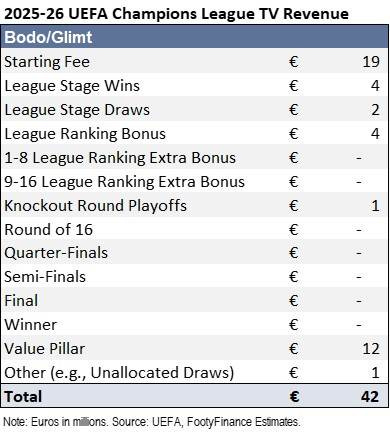
Revenue by Club – Norway
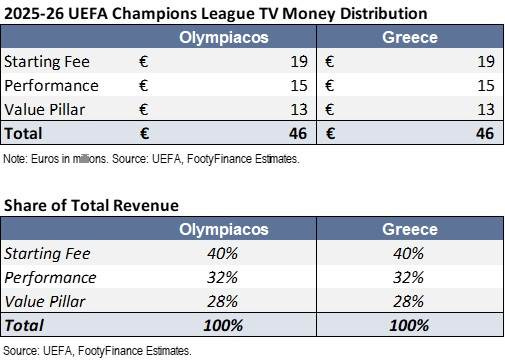
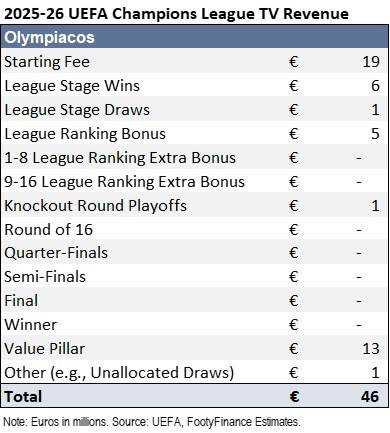
Revenue by Club – Greece
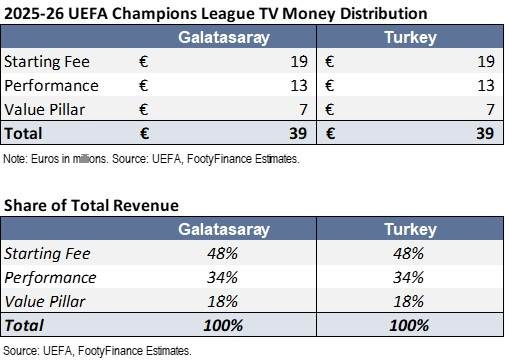
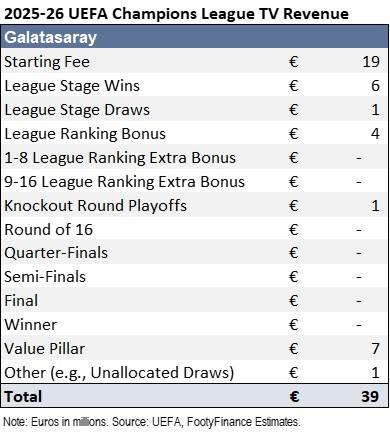
Revenue by Club – Turkey
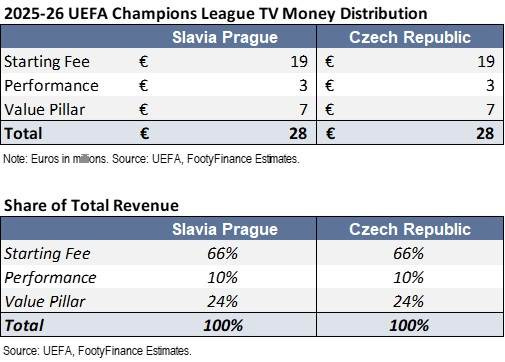
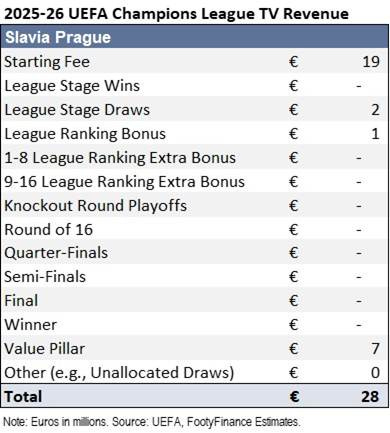
Revenue by Club – Czech Republic
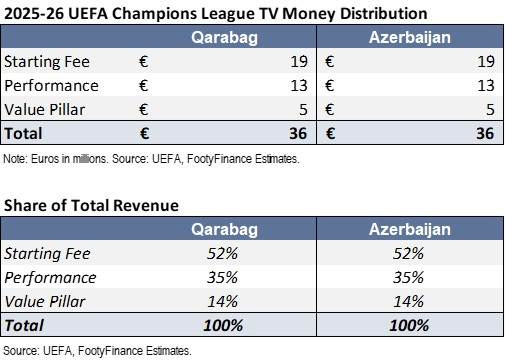
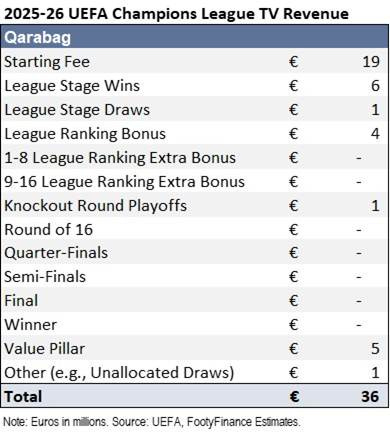
Revenue by Club – Azerbaijan
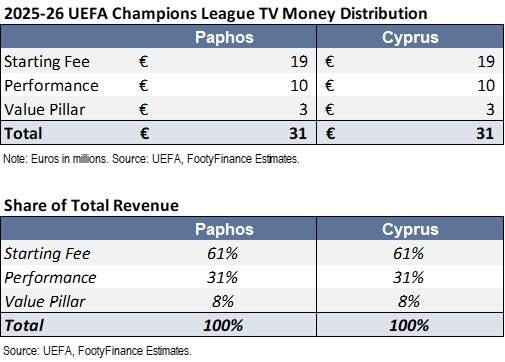
Revenue by Club – Cyprus
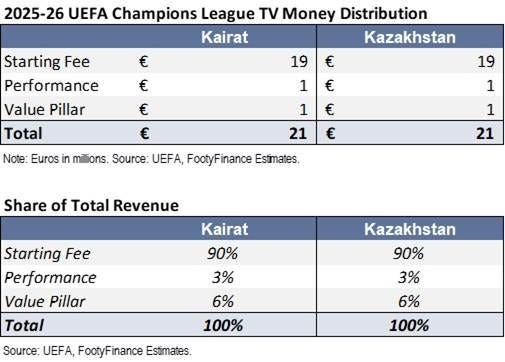
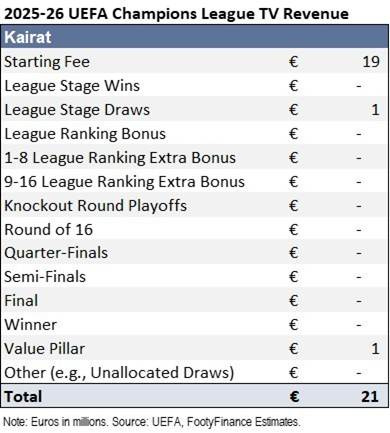
Revenue by Club – Kazakhstan