Key Message: This report details updated Tottenham Hotspur model incorporating 1) the latest Premier League/Champions League broadcasting revenue forecasts, 2) revised commercial/matchday revenue estimates, and 3) financial impacts of the January transfer window. 2025/26 season total revenue forecast is £46mm lower to £581mm (+4% y/y) driven by downward revision across all three revenue segments. Downward revision to Broadcasting revenue is driven by both lower EPL revenue (Spurs currently sitting 16th in the table) and lower domestic cups revenue (Spurs eliminated from both EFL Cup and FA Cup). UEFA Champions League revenue (latest forecast here) is £4mm higher reflecting better than expected league stage performance. Lower Commercial revenue outlook (now £245mm vs. £266mm prior) is driven by expectation that subpar EPL performance impacts sponsorship payouts this season (press reports indicate “tens of millions” impact – link). Lower matchday revenue is driven by two less games than previously forecasted and flat y/y average matchday yield growth (vs. +5% prior). Profitability metrics are also lower (EBITDA forecast down -£49mm to £169mm/29% margin, Operating Loss down -£41mm to -£61mm/-11% margin) driven by 1) flow through of revised revenue outlook, and 2) effects of January transfer window activity on player wages/amortization. Net effects of player sales (Brennan Johnson), player purchases (Mason Melia, Conor Gallagher, Souza), and outgoing player loans (Kota Takai, Dane Scarlett) are 1) staff costs (i.e., wages) £4mm higher to £245mm (+12% y/y), 2) amortization £3mm lower to £158mm (+18% y/y), and 3) total profit on player sales of £31mm for the 2025/26 season (unchanged). 2025/26 Free Cash Flow forecast is now -£202mm (vs. -£146mm prior) impacted by lower cash generated from operating activities and increased cash used for player purchases (now £345mm outflow vs. £332mm prior). Based on updated revenue forecast, equity valuation is now £2.4bn (vs. £2.7bn prior) using 6.0x EV/Sales multiple (unchanged). Initial January 4th forecast can be found here.
Estimate Revisions
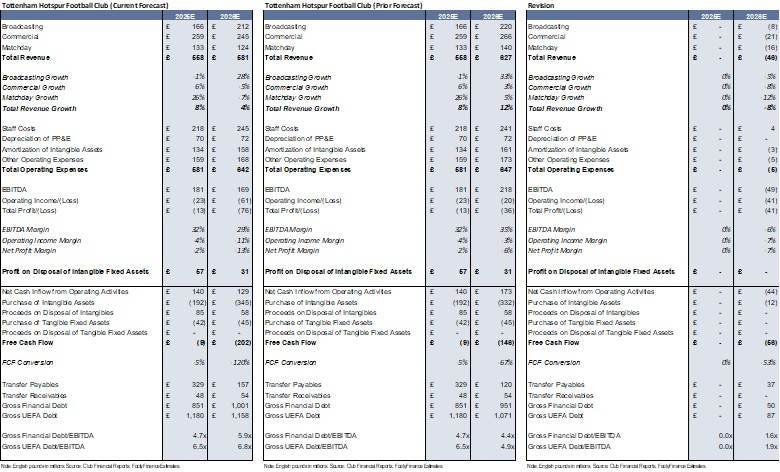
Drivers of Revisions to 2025/26 Season Forecast
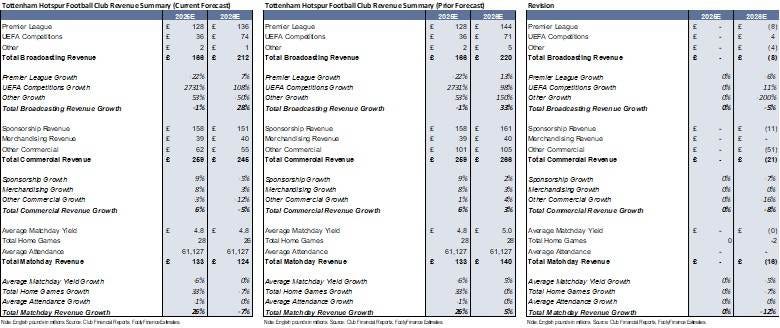
- Broadcasting Revenue: -£8mm lower based on downward revision to EPL and domestic cups revenue forecast, partially offset by higher UEFA Champions League contribution
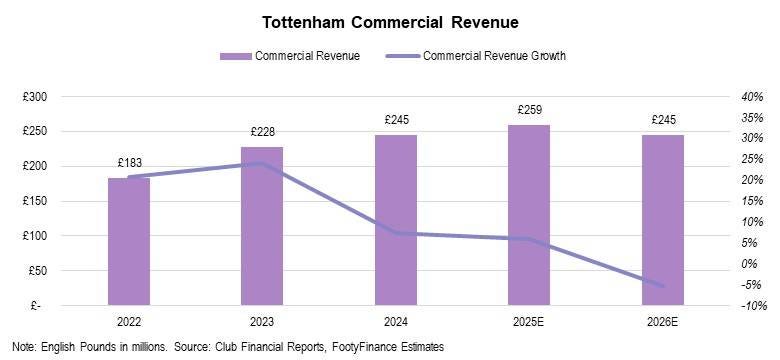
- Commercial Revenue: -£21mm lower driven by expectation that subpar EPL performance impacts sponsorship payouts this season (press reports indicate “tens of millions” impact – link)
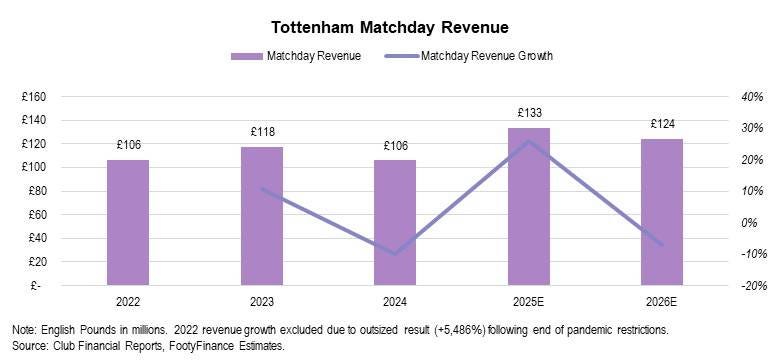
- Matchday Revenue: -£16mm lower driven by two less games than previously forecasted and flat y/y average matchday yield growth (vs. +5% prior)
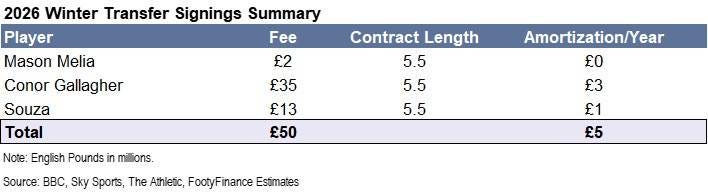
- Player Sales Cash Outflow: £12mm higher driven by purchases of Mason Melia, Conor Gallagher, Souza (assumed 25% of gross transfer fee paid in cash in year one)
- £7mm impact to 2025/26 wages (£14mm next year once wages are for a full year)
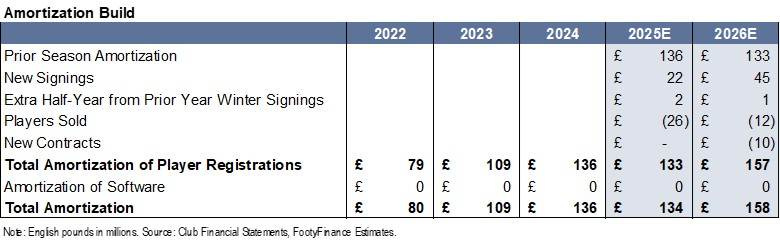
- £5mm impact to amortization in 2025/26 (£10mm next year once amortization stretches over a full year)
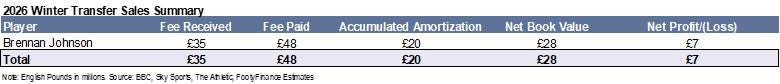
- Player Sales Cash Inflow: £16mm inflow from sale of Brennan Johnson (assumed 45% of gross transfer fee received in cash in year one)
- £3mm benefit to 2025/26 wages expense
- £4mm benefit to amortization expense
- Player Loans: Dane Scarlett and Kota Takai outgoing loans for second half of the season lowers wages by £0.7mm
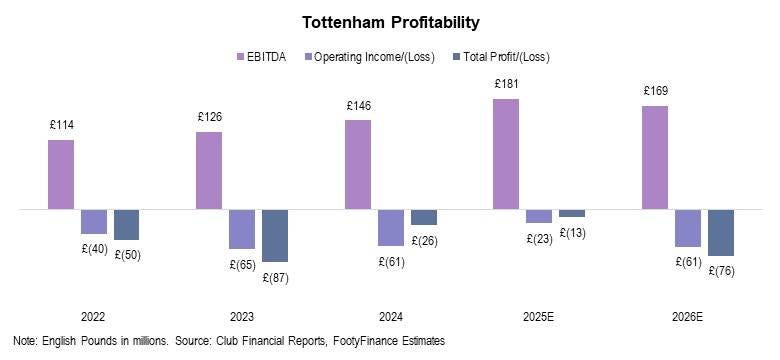
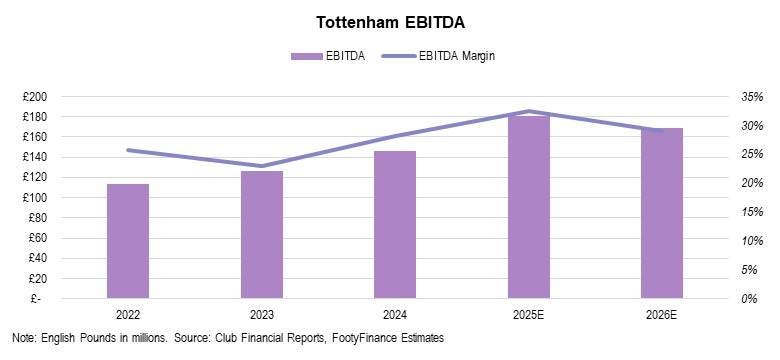
- EBITDA: Down -£49mm to £169mm/29% margin
- Operating Loss: Down -£41mm to -£61mm/-11% margin
- Net Loss: Down -£41mm to -£76mm/-13% margin
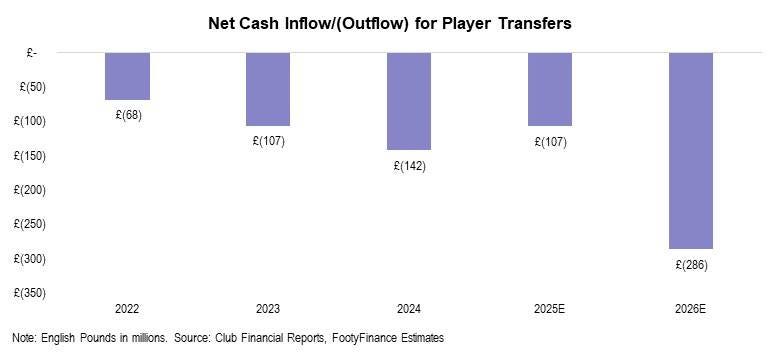
- Free Cash Flow: -£56mm lower driven by downward revenue revision and player purchases cash outflow
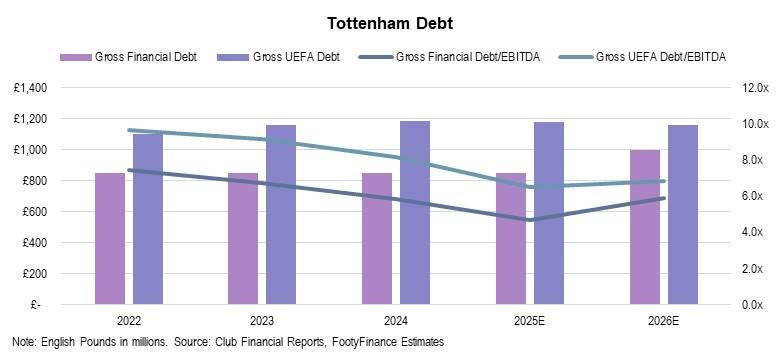
- Gross UEFA Debt: £87mm higher driven by player purchases and financial debt raise
Summary Model
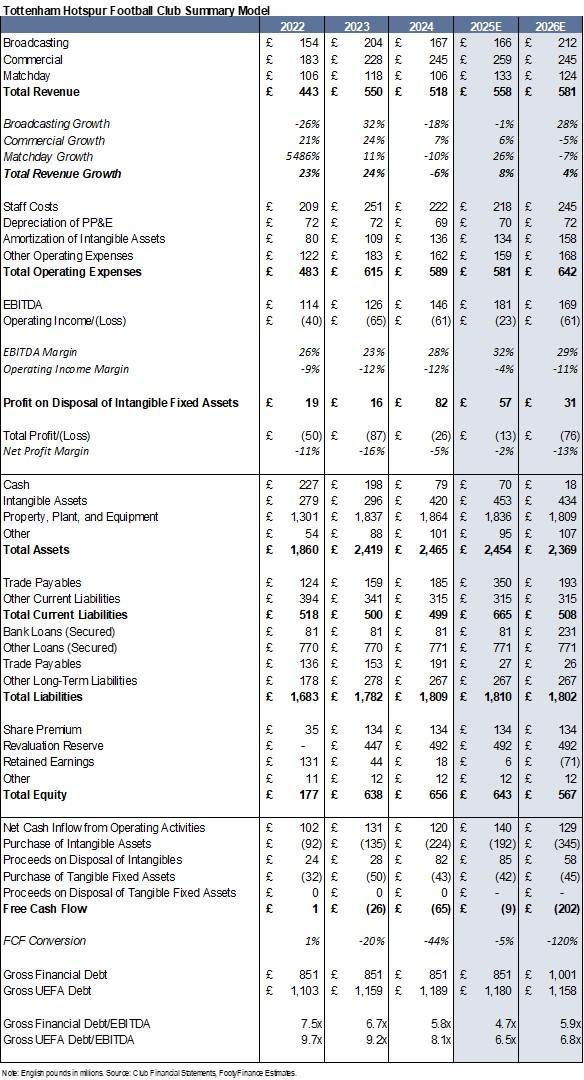
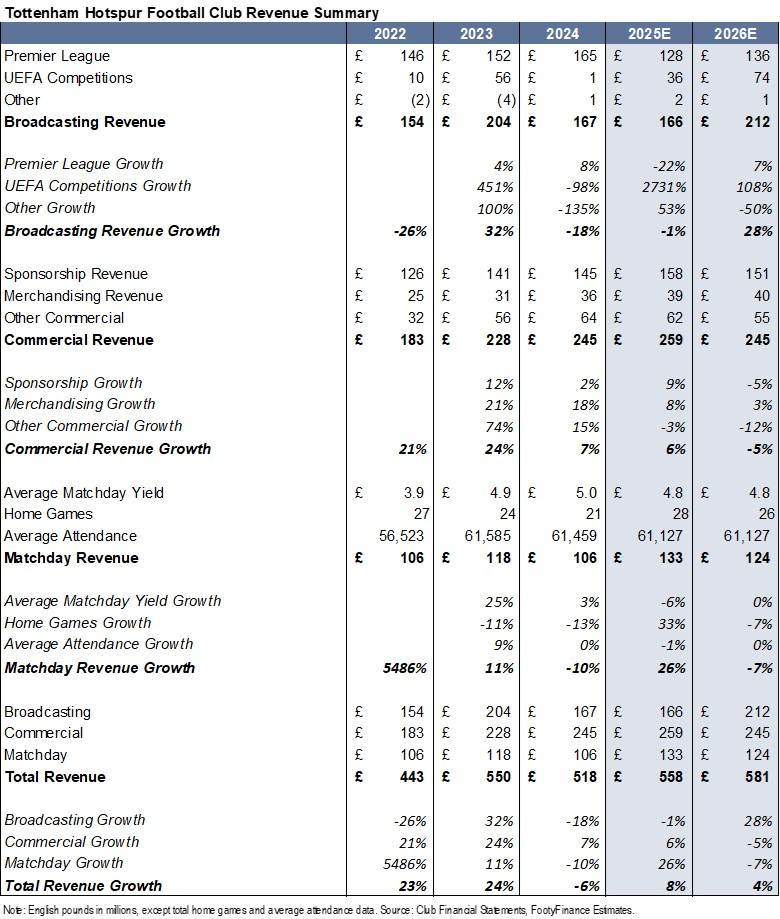
Revenue
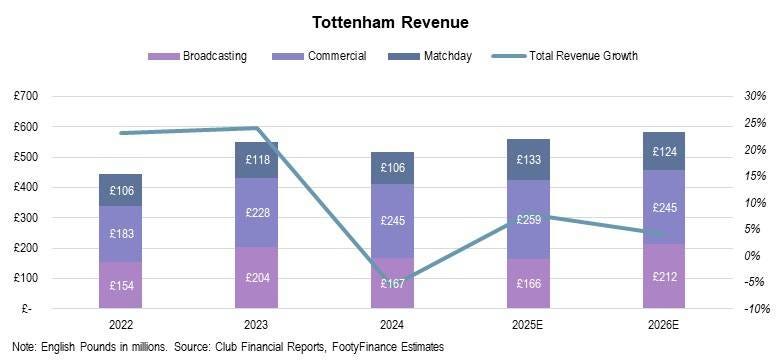
For the 2025/26 season total revenue is forecasted to be £581mm (+4% y/y) with gains led entirely by Broadcasting (+28%). Commercial (-5%) and Matchday (-7%) revenues are expected to see declines.
Broadcast Revenue
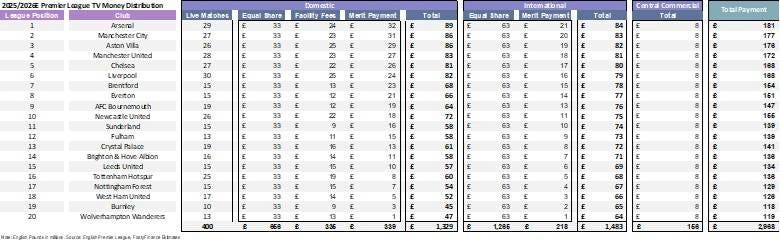
Based on current standing for a sixteenth place EPL finish, EPL Broadcast revenue is expected to come in at £136mm for the 2025/26 season (+7% y/y) following seventeenth place finish in the 2024/25 season).
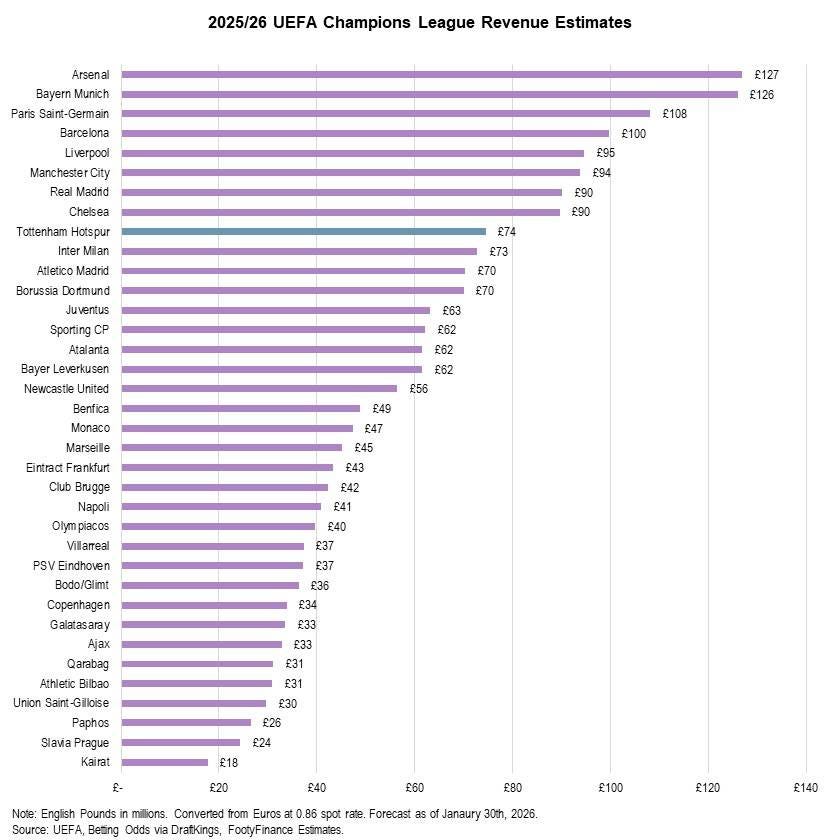
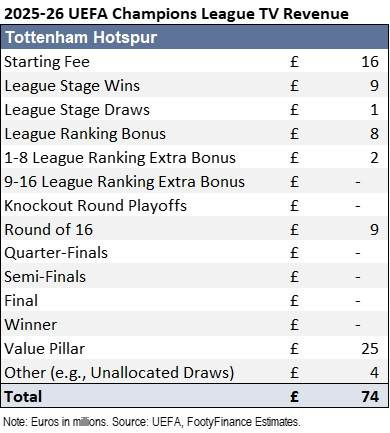
Odds for the UEFA Champions League currently value Tottenham as the tenth most likely to win the competition. For modeling purposes pre-completion of the knockout stage, tenth highest odds to win are assumed to be equivalent to finishing in the round of 16 stage of the competition. Tottenham direct qualified for the round of 16 and will not play in the knockout round. A round of 16 finish is expected to garner Tottenham City UEFA revenue of £74mm for the 2025/26 season (+108% y/y following Europa League win in 2025/26). See latest Champions League forecast here.
Additionally, £1mm contribution from domestic cup competitions is expected. Tottenham exited both the EFL Cup and FA Cup after one round in the 2025/26 season.
Commercial Revenue
Commercial revenue growth is forecasted to decline 5% in the 2025/26 season (vs. +6% growth expected in 2024/25) driven by subpar EPL performance impacting sponsorship payouts (press reports indicate “tens of millions” impact – link).
Matchday Revenue
Matchday revenue is expected to decline 7% in the 2025/26 season (vs. +26% growth expected in 2024/25) driven by two less games vs. the prior season and flat y/y average matchday yield growth.
Player Transfers
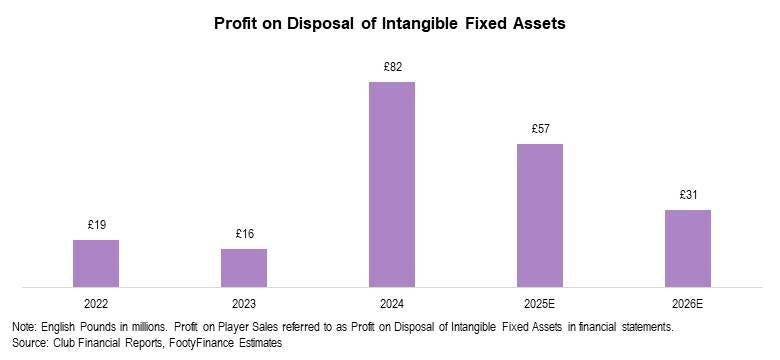
Tottenham is forecasted to see profit on disposal of player registrations of £31mm for the 2026/26 season driven by £24mm gain on summer 2025 sales and £7mm gain on January 2026 sales. The £31mm gain compares to £57mm profit in the 2024/25 season and £39mm average from 2021/22 through 2023/24.
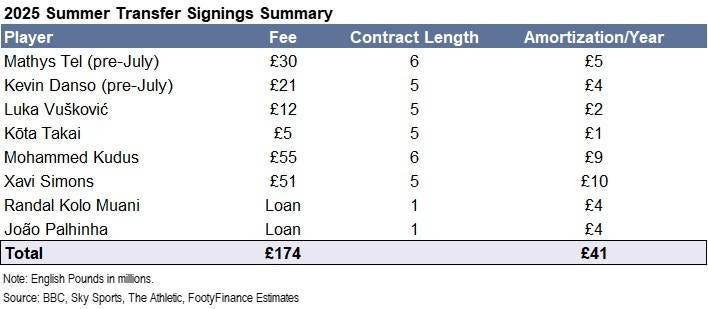
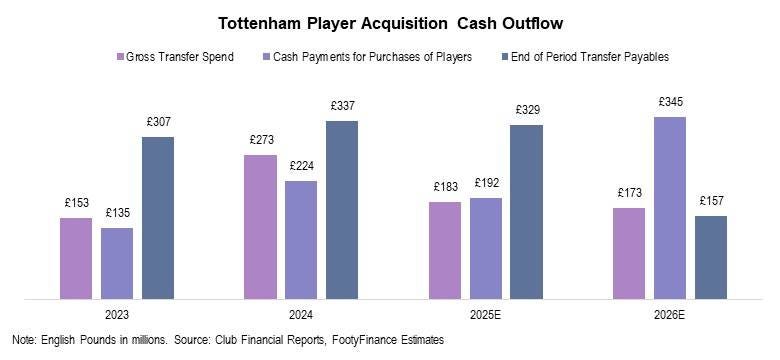
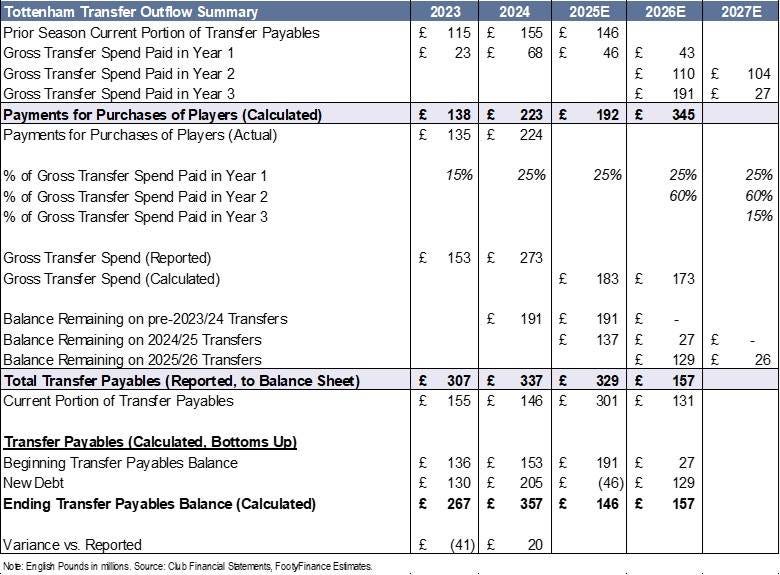
From a cash outflow perspective, Tottenham has recorded gross transfer spend of £223mm across the summer 2025 and winter 2026 transfer windows. Note that because Tottenham has a financial year end of June 30, any signings or sales made prior to July are included in the 2024/25 season results. Therefore, of this £223mm gross transfer spend, £173mm will be included in the 2025/26 financial year with the remainder in 2024/25. Summer 2025 signings included in the 2024/25 financial year are distinguished by “Pre-July” in the table below.
Because cash payments/receipts for player purchases/sales are typically paid/received through installment plans over multiple seasons, cash outflow/inflow amounts differ from gross transfer spend/income each season. Tottenham is forecasted to have total cash outflow of £345mm for the 2025/26 season.
To calculate cash outflow for the first forecast year (2024/25 in the case of Tottenham), the prior season’s reported, current transfer payables are taken and added to an estimated % of gross transfer spend paid (in cash) for the 2024/25 season (for forecast years, this % is aligned with historical trend). To calculate gross transfer spend in the forecast years, all press reported values for transfers in each season are summed together.
To calculate cash outflow for the second forecast year (2025/26 in the case of Tottenham), a three-year installment plan for transfer payments is assumed given there is not a current transfer payable amount reported yet for the 2024/25 season. Year one transfer cash payments reflect 25% of 2025/26 season gross transfer spend; year two payments reflect 60% of 2024/25 season gross transfer spend; and year three payments reflect the non-current portion of 2023/24 transfer payables (current portion will be paid in the 2024/25 season with remainder assumed to be paid ~three seasons later in 2025/26). A full guide to transfer cash flow and debt forecasting methodology can be found here.
The £345mm cash outflow estimate for the 2025/26 season includes £43mm related to 2025/26 transfers, £110mm for 2024/25 transfers, and £191mm for 2023/24 transfers.
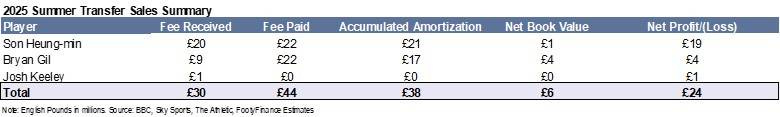
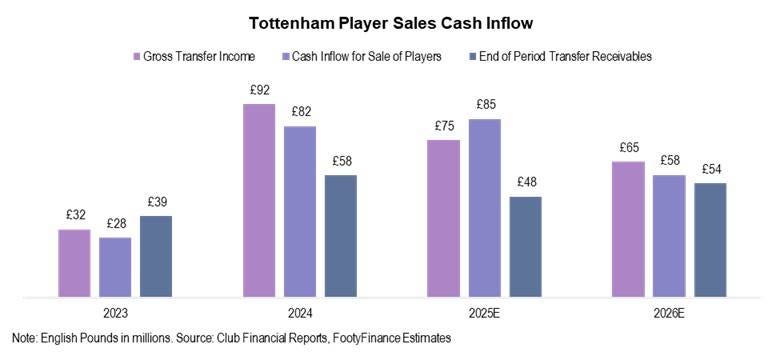
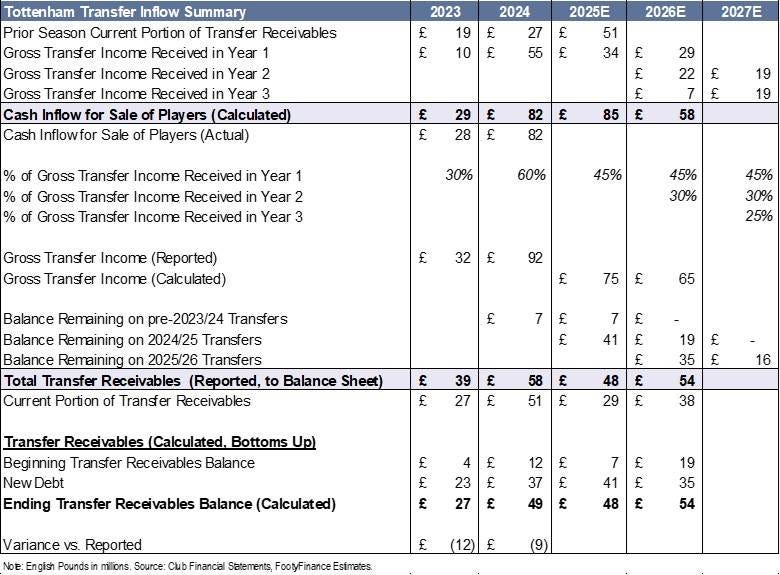
From a cash inflow perspective, Tottenham is estimated to have gross transfer income of £30mm in the 2025 summer window and £35mm in the 2026 January window. Due to effect of installment payments, total cash inflow from player sales is expected to be £58mm in the 2025/26 season. Forecasting for transfer cash inflow follows the same methodology as transfer cash outflows. No major sales occurred prior to June 30 and thus all summer 2025 transactions are included in the 2025/26 financial year.
To calculate cash inflow for the first forecast year, the prior season’s reported, current transfer receivables are taken and added to an estimated % of gross transfer income received (in cash) for the 2024/25 season (this % is aligned with historical trend for forecast years). To calculate gross transfer income in the forecast years, all press reported values for transfers in each season are summed together.
To calculate cash inflow for the second forecast year, a three-year installment plan for transfer sales is assumed given there is not a current transfer receivable amount reported yet for the 2024/25 season. Year one transfer cash inflow reflects 45% of 2025/26 season gross transfer income; year two proceeds reflect 30% of 2024/25 season gross transfer income; and year three payments reflect the non-current portion of 2023/24 transfer receivables (current portion will be received in the 2024/25 season with remainder assumed to be received ~three seasons later in 2025/26).
The £58mm cash inflow estimate for the 2025/26 season includes £29mm related to 2025/26 transfer sales, £22mm from 2024/25 transfers, and £7mm from 2023/24 transfers.
Full transfer cash outflow and inflow summary is provided in the tables below. Note that the 2027E forecasting year is used solely for calculating current transfer payable/receivable amounts for the 2026E financial year.
Expenses
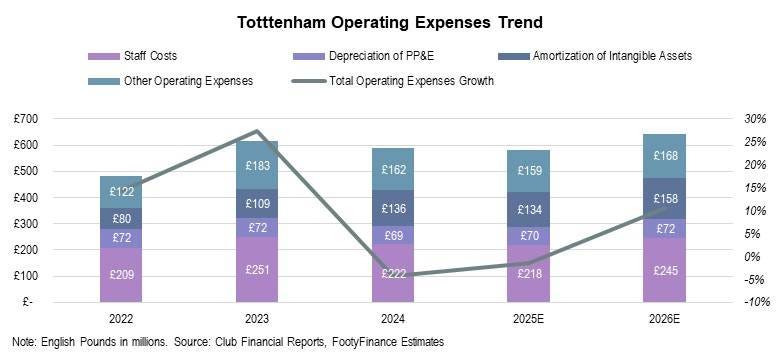
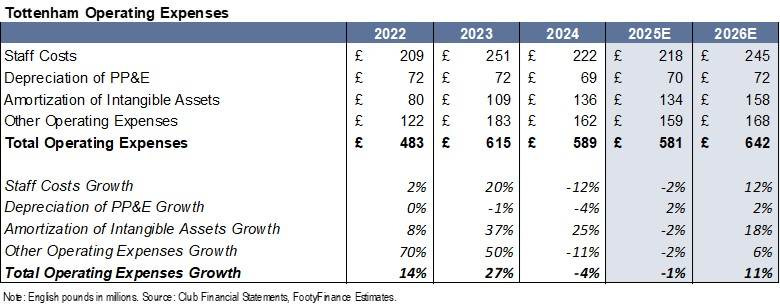
Expense growth is expected to accelerate in the 2025/26 season (+11% vs. -1% in the 2024/25 season) primarily driven by new player signings with Staff Costs +12% y/y and Amortization of Registrations +18% y/y.
Profitability
Current model shows slight EBITDA decline in the 2025/26 season with operating income continuing to run negative. Net income gets the benefit of profit from player sales.
EBITDA
EBITDA margin is expected to contract in the 2025/26 season to 29% (vs. 32% expected in the 2024/25 season). EBITDA margin is still slightly above 2021/22 through 2023/24 average of 26%.
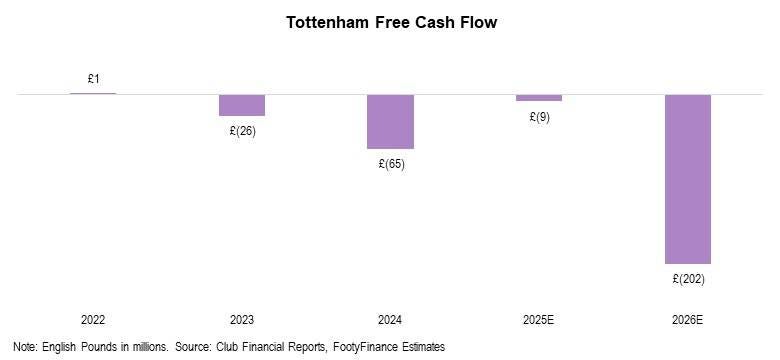
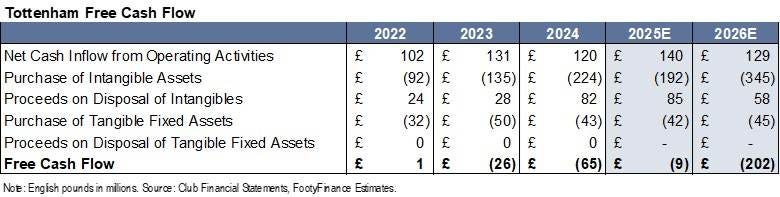
Free Cash Flow
Expect Free Cash Flow to decline in the 2025/26 season to -£202mm following £9mm estimated outflow in the 2024/25 season.
Debt
Current model has gross financial debt at £1,001mm in the 2025/26 season (above most recently reported figure of £851mm in the 2025/26 season). Gross UEFA debt is expected to decrease from estimated £1,180mm in the 2024/25 season to £1,158mm in 2025/26 driven by relatively lower volume transfer activity. Note that Financial Debt includes traditional debt instruments such as owner debt and external loans. UEFA debt adds transfer debt on top of the financial debt figure.
Valuation
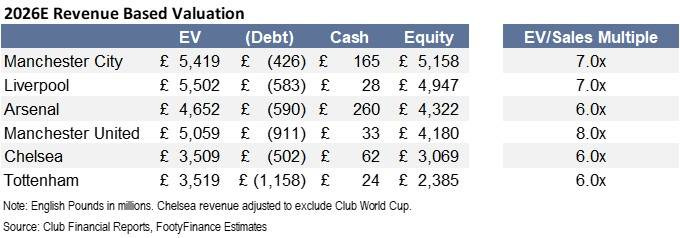
Based on current revenue forecast of £581mm for the 2025/26 season, Tottenham equity is valued at £2.4bn using a 6.0x EV/Sales multiple (in-line with ~6.0x “Big Six” average per Sportico, Forbes, and CNBC). While Tottenham is typically a top six EPL challenger with occasional runs in European competitions, the club’s inconsistent on-field performance and relatively smaller commercial appeal compared to other Big Six clubs hampers the valuation multiple. Further, the valuation benefit from higher matchday revenue output as a result of the new stadium is largely offset by high stadium-related debt load.
Disclaimer
This report discusses valuation of Tottenham Hotspur Football Club for informational purposes only and does not constitute investment advice. All investment decisions should be made at one’s own risk and/or with the advice of an investment professional.
This report presents a view only as of the date of this communication and any opinions, estimates, and assumptions expressed herein are made as of the date of this communication. The information contained may be subject to change and/or withdrawal without notice or become incorrect due to passage of time and/or as a result of legal, political, economic, and other changes. FootyFinance does not assume responsibility to notify you of such changes and/or furnish an updated report. FootyFinance does not assume responsibility for results from this model.
FootyFinance is not, by making this material available, providing legal, regulatory, tax, financial, or accounting advice to the recipient of this report or any other party. Sources for the information herein are believed to be reliable, but FootyFinance makes no representation and gives no warranty as to the completeness or accuracy of the information contained herein. Past performance is not indicative of future results. No liability is accepted by FootyFinance for any losses that may arise from any use of or reliance on the information contained herein.