Key Message: Under manager Pep Guardiola and owner Sheikh Mansour, Manchester City has reigned as the undisputed king of English football over the past decade. The club has won six out of the last ten EPL titles (vs. two for next closest competitor Liverpool) alongside a Champions League victory in 2023. Per my forecast, Manchester City is on track to achieve league high revenue of £790mm for the 2025/26 season (+14% y/y) underpinning an equity valuation of £5.3bn (based on 7.0x EV/Sales multiple). Within, I further detail initial 2025/26 financial forecast for Manchester City across all key KPIs. I plan to update estimates on a regular basis as the season progresses.
Revenue
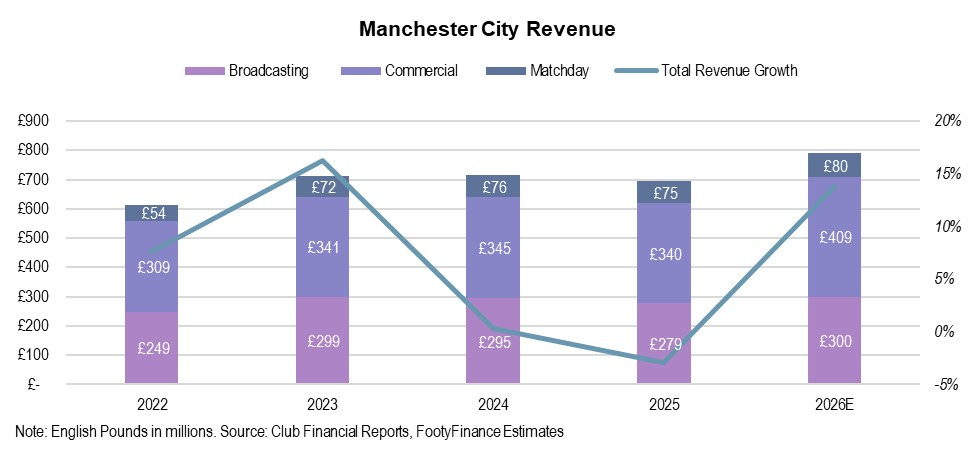
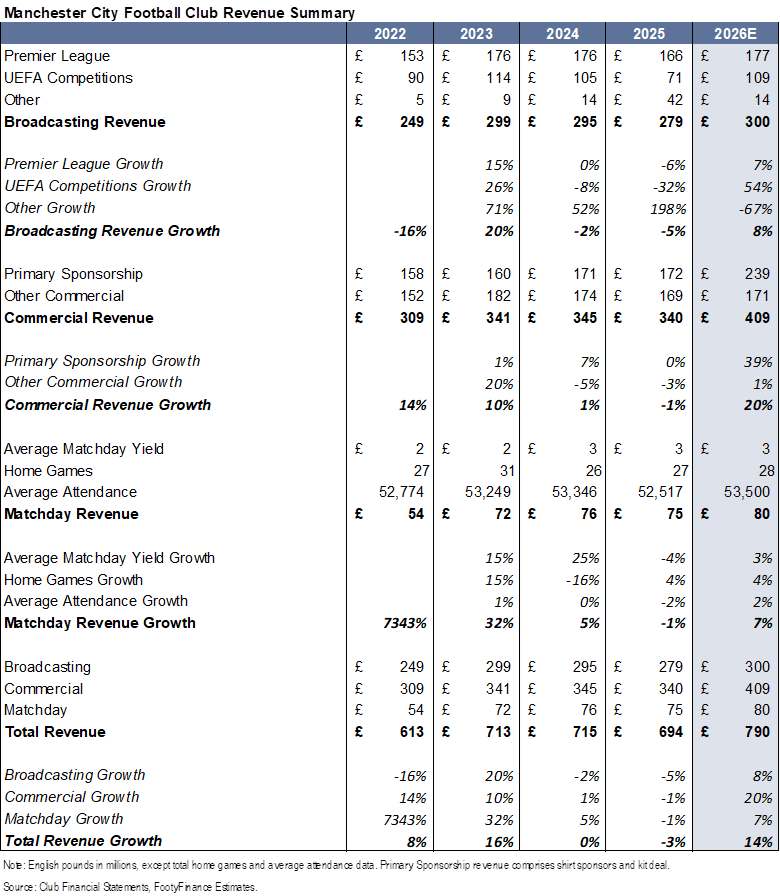
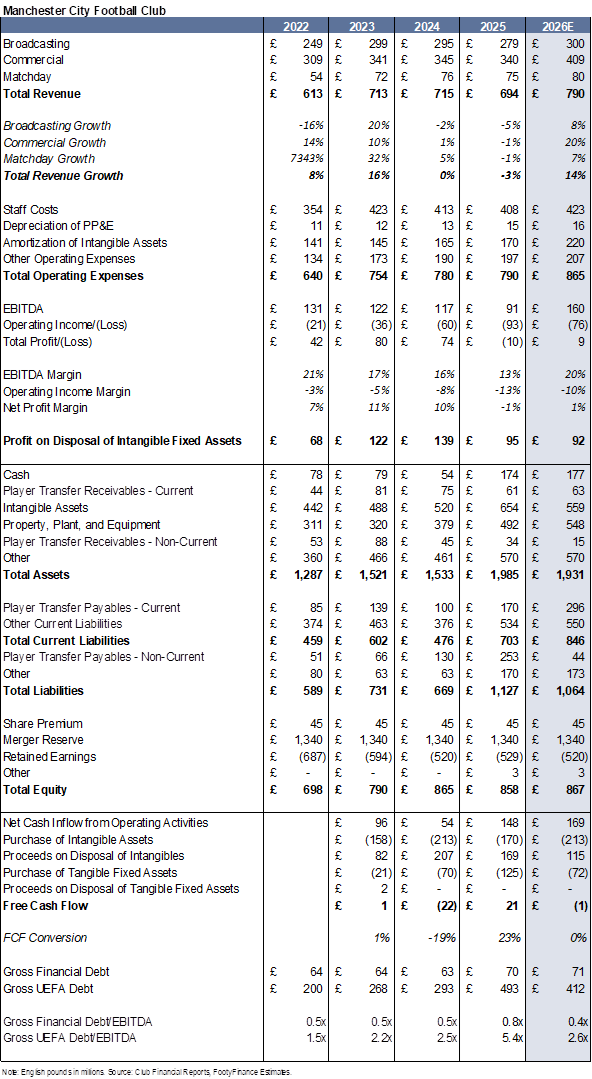
For the 2025/26 season I forecast total revenue of £790mm (+14% y/y) with gains primarily led by Commercial (+20%) followed by Broadcasting (+8%) and Matchday (+7%). Following flat revenue growth in 2023/24 and -3% decline in 2024/25, Manchester City is on track to accelerate revenue growth in the 2025/26 season.
Broadcast Revenue
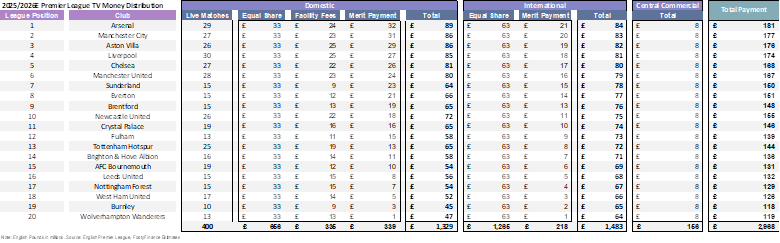
Based on current standing for a second place finish in the EPL, I forecast EPL Broadcast revenue of £177mm for the 2025/26 season (+7% y/y following third place finish in the 2024/25 season). 2024/25 season Broadcasting revenue had a £38mm tailwind from participation in the summer 2025 Club World Cup. I believe all earnings from this competition were included in the 2024/25 financial year given Manchester City’s final game was June 30. Absent benefit from the Club World Cup, 2024/25 Broadcasting revenue would have declined 18% y/y (vs. -5% with benefit).
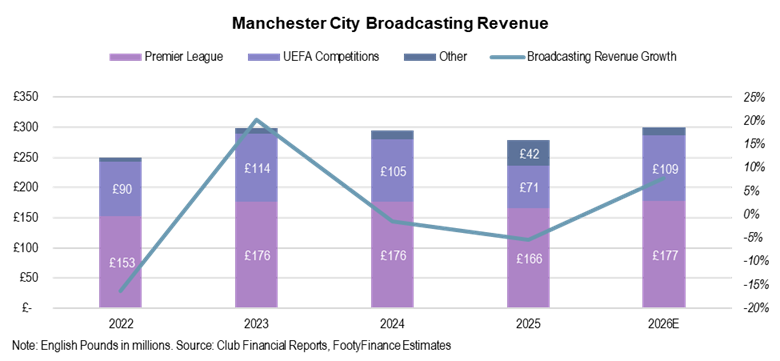
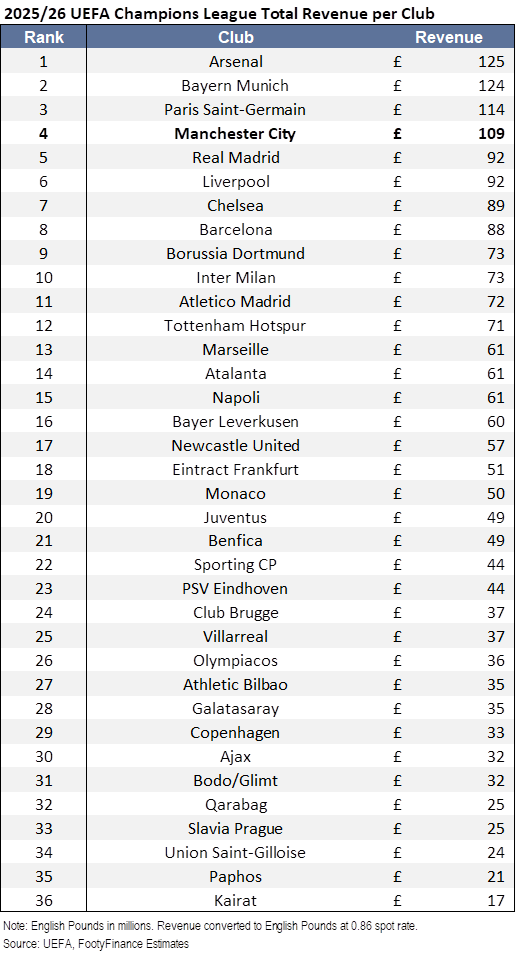
Odds for the UEFA Champions League currently value Manchester City as the fourth most likely to win the competition. For purposes of my model pre-completion of the competition, I assume fourth best odds to win as equivalent to exiting the competition in the semi-finals. Reaching the semi-finals garners UEFA revenue of £109mm for the 2025/26 season (+54% y/y following knockout stage playoffs exit in 2024/25).
Additionally, I model modest contribution of £14mm in revenue from the EFL Cup and FA Cup.
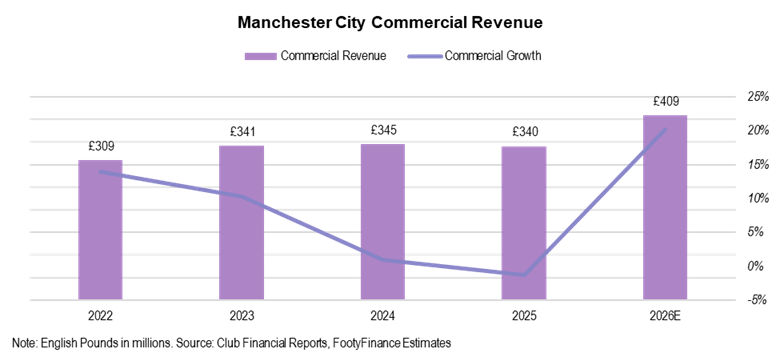
Commercial Revenue
I expect Manchester City’s Commercial revenue growth rate to significantly accelerate to +22% in the 2025/26 season (vs. -1% decline in 2024/25) driven by reported renewals with both Puma and Emirates.
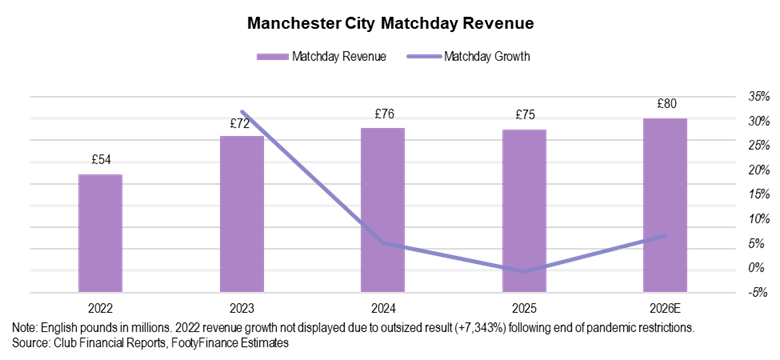
Matchday Revenue
For matchday, I expect Manchester City to benefit from a deeper run in the Champions League relative to the 2024/25 season. I currently model matchday revenue of £80mm for the 2025/26 season (+7%) vs. £75mm in the 2024/25 season.
Full revenue summary is provided in the table below.
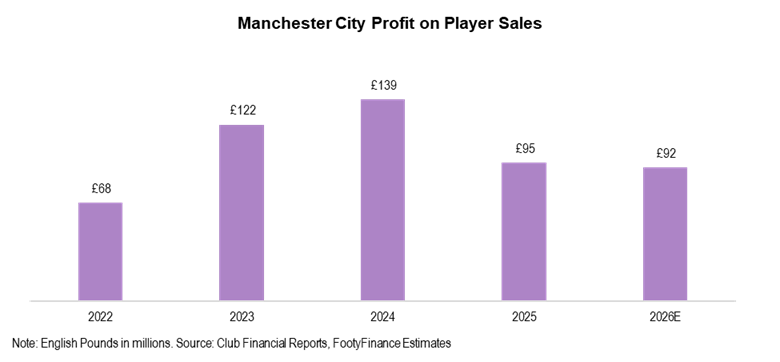
Player Transfers
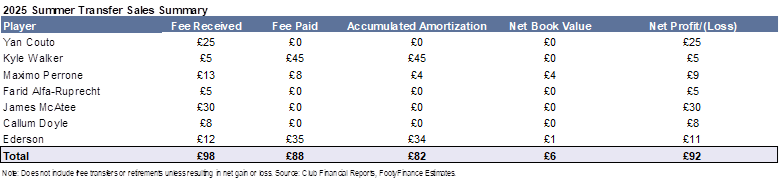
I currently model profit on disposal of player registrations of £92mm for the 2025/26 season (vs. £95mm profit in 2024/25 and £109mm average from 2021/22 through 2023/24). Note that 2025/26 season estimates do not factor in potential winter transfers (assumed £0mm profit until official transfers are completed). Academy players James McAfee (£30mm) and Yan Couto (£25mm) are so far the largest drivers of player sale profit in 2025/26.
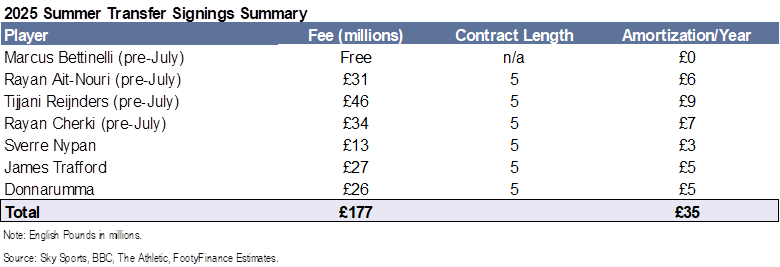
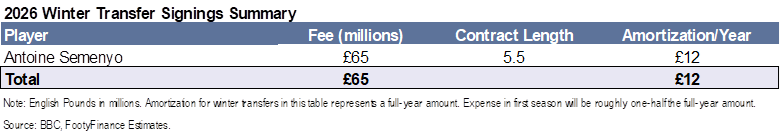
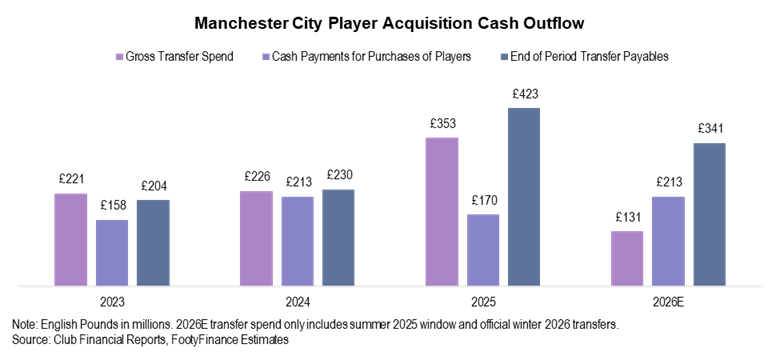
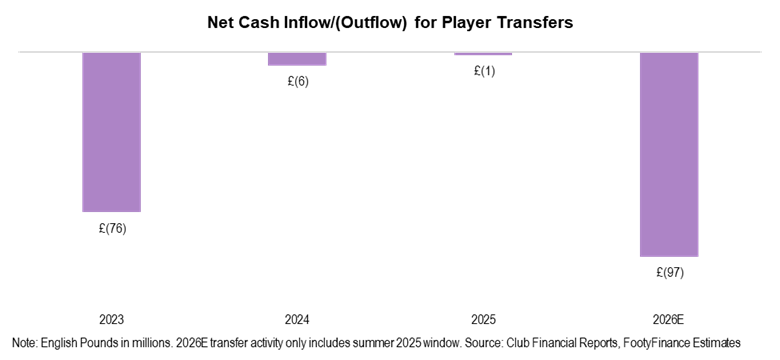
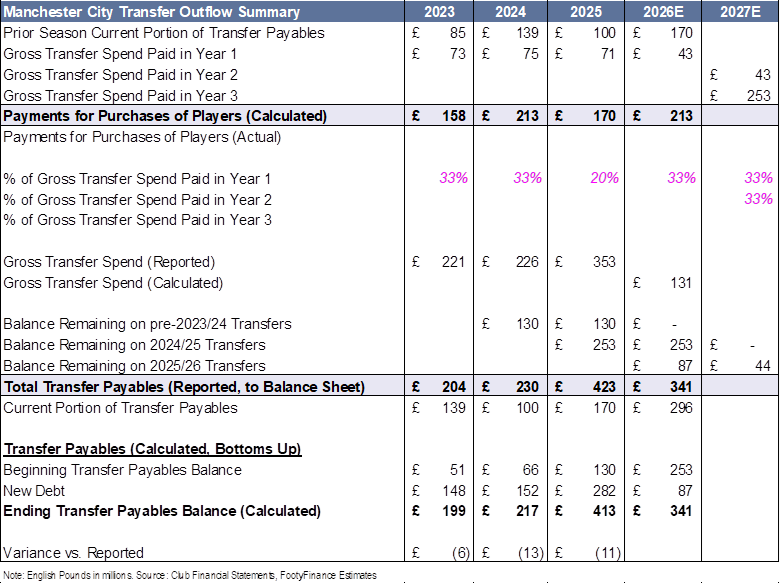
From a cash outflow perspective, I estimate gross transfer spend of £242mm across the summer 2025 and winter 2026 transfer windows, with total cash outflow of £213mm for the 2025/26 season. Winter 2026 spend only includes completed transfers with potential to move higher in the coming weeks. Note that because Manchester City has a financial year end of June 30, any signings or sales made prior to July are included in the 2024/25 season results. Therefore, of this £242mm gross transfer spend, I estimate £131mm will be included in the 2025/26 financial year with the remainder in 2024/25. Summer 2025 signings included in the 2024/25 financial year are distinguished by “Pre-July” in the table below.
Note: Manchester City does not officially report a cash flow statement. All cash flow figures cited in this report are calculated using press reports and reported balance sheet data that includes transfer payables and transfer receivables. Cash flow estimates are optimized to minimize variance between bottoms up transfer payables/receivables estimates and reported figures. Player transfer related cash flow estimates go back to the 2022/23 season for Manchester City (vs. 2021/22 season for all other Big Six Clubs).
Because cash payments/receipts for player purchases/sales are typically paid/received through installment plans over multiple seasons, cash outflow/inflow amounts differ from gross transfer spend/income each season.
To calculate cash outflow for the first (and only) forecast year (2025/26 in the case of Manchester City), I take the prior season’s reported, current transfer payables and add that amount to an estimated % of gross transfer spend paid (in cash) for the 2025/26 season (I align this % with historical trend for forecast years). To calculate gross transfer spend in the forecast years, I sum up all press reported values for transfers in each season. A full guide to my transfer cash flow and debt forecasting can be found here.
The £213mm cash outflow estimate for the 2025/26 season includes £170mm of current transfer payables reported at the end of the 2024/25 season and 33% (£43mm) of estimated gross transfer spend for the 2025/26 season. Like player sale profit, I only forecast officially completed winter transfer spend due to significant variability between periods.
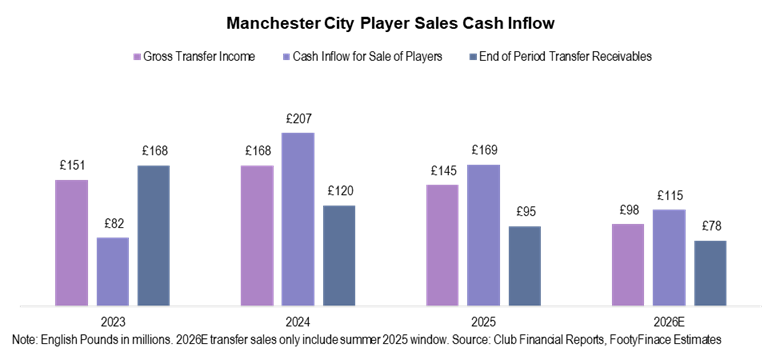
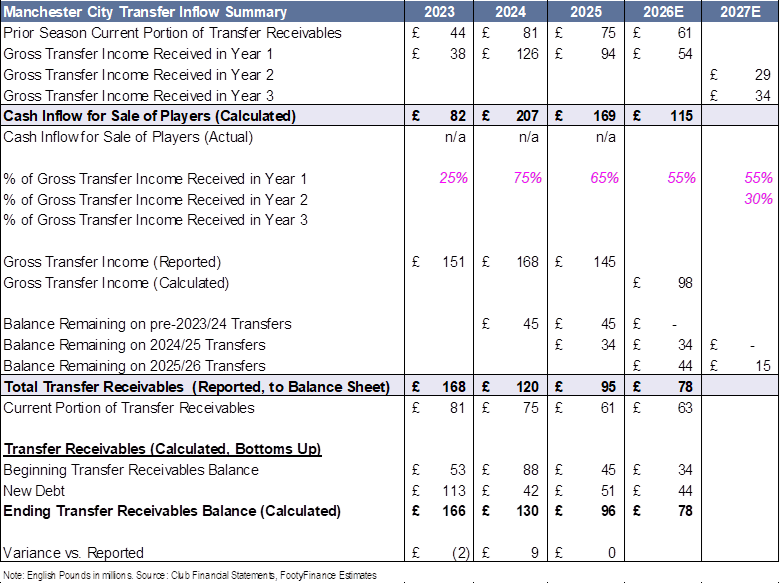
From a cash inflow perspective, I estimate gross transfer income of £98mm in the 2025 summer window with cash inflow of £115mm expected for the 2025/26 season. As of this report, no winter 2026 sales have occurred. Forecasting for transfer cash inflow follows the same methodology as transfer cash outflows. No major sales occurred prior to June 30 and thus all summer 2025 transactions are included in the 2025/26 financial year in my model.
To calculate cash inflow for the first (and only) forecast year, I take the prior season’s reported, current transfer receivables and add that amount to an estimated % of gross transfer income received (in cash) for the 2025/26 season (I align this % with historical trend for forecast years). To calculate gross transfer income in the forecast years, I sum up all press reported values for transfers in each season.
The £115mm cash inflow estimate for the 2025/26 season includes £61mm of current transfer receivables reported at the end of the 2024/25 season and 55% (£54mm) of estimated gross transfer income for the 2025/26 season.
Full transfer cash outflow and inflow summary is provided in the tables below. Note that the 2027E forecasting year is used solely for calculating current transfer payable/receivable amounts for the 2026E financial year.
Expenses
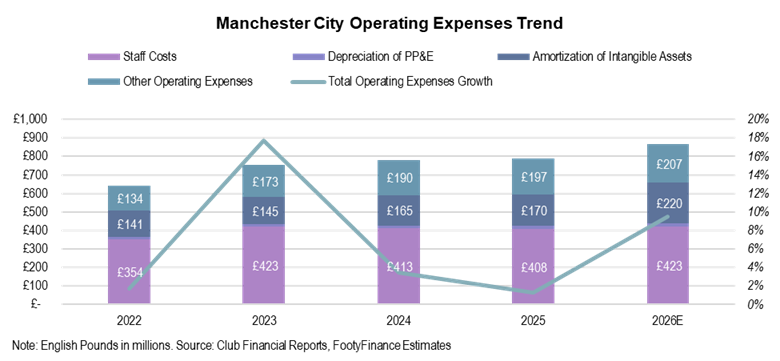
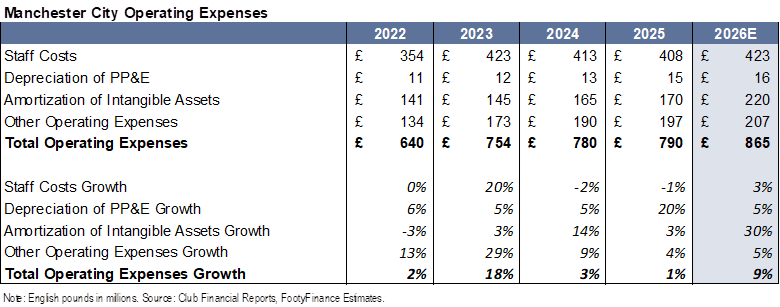
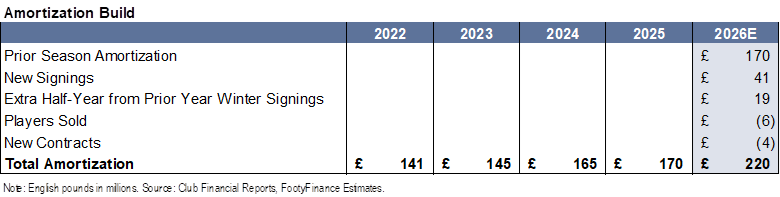
I expect Manchester City’s expense growth to accelerate to +9% y/y in the 2025/26 season (vs. +1% in 2024/25) primarily driven by player amortization costs (+30% vs. +3% in 2024/25).
Profitability
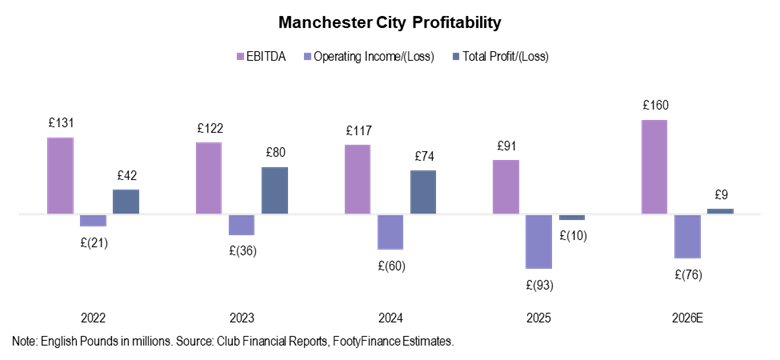
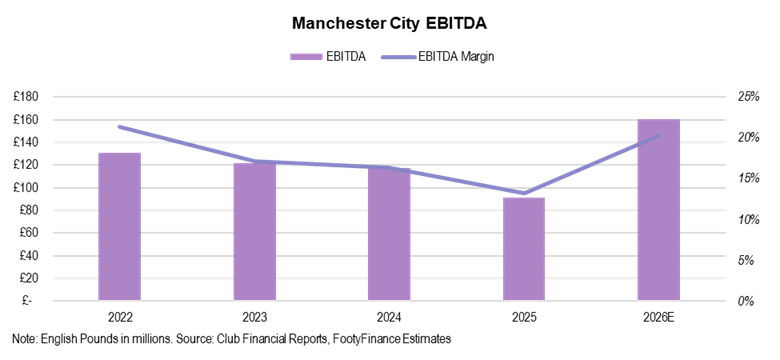
I forecast strong EBITDA growth for Manchester City in the 2025/26 season with operating income continuing to run negative and net income seeing slight improvement. I primarily focus on EBITDA as the main profitability metric.
EBITDA
From a profitability standpoint, I expect EBITDA margin to significantly expand in the 2025/26 season to 20% (vs. 13% in the 2024/25 season). Following a disappointing 2024/25 season from a Broadcasting revenue perspective, 2025/26 EBITDA margin is more in-line with 2021/22 through 2023/24 average margin of 18%.
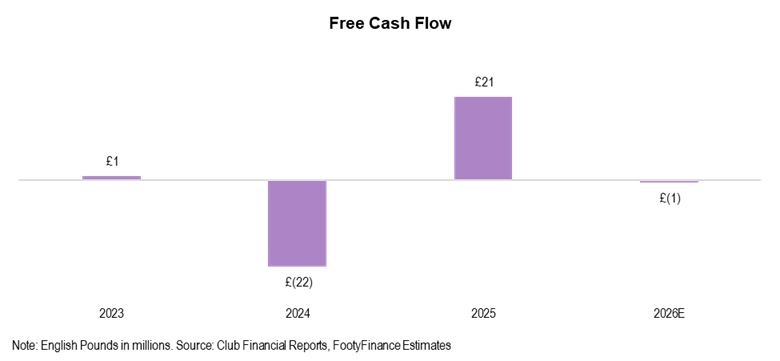
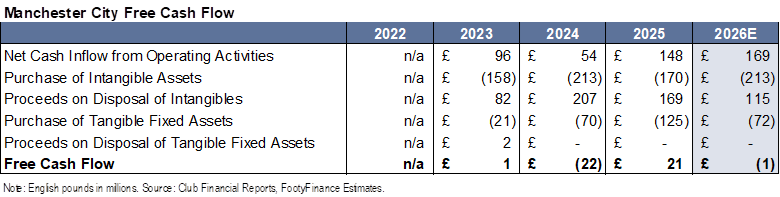
Free Cash Flow
I expect Free Cash Flow to slightly decline in the 2025/26 season though only down -£1mm following £21mm estimated inflow in the 2024/25 season. As mentioned previously, Manchester City does not officially report a cash flow statement. All cash flow figures cited in this report are calculated using press reports and reported balance sheet data.
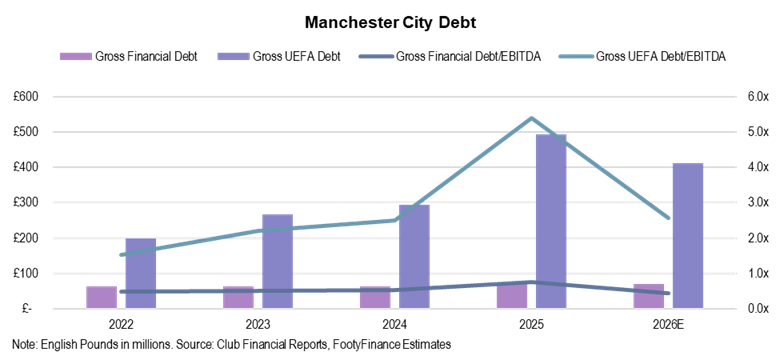
Debt
I forecast gross financial debt of £71mm in the 2025/26 season (consistent with most recently reported figure of £70mm in the 2024/25 season). I expect gross UEFA debt to decrease from £493mm in the 2024/25 season to £412mm in 2025/26 driven by relatively lower volume transfer activity. Note that Financial Debt includes traditional debt instruments such as owner debt and external loans. UEFA debt adds transfer debt on top of the financial debt figure.
Valuation
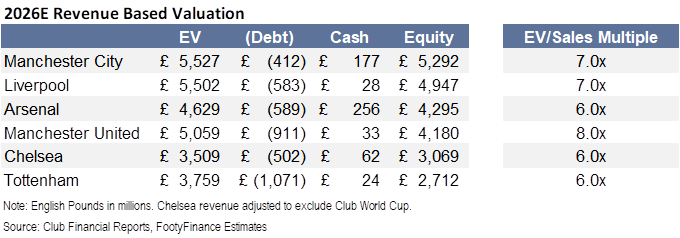
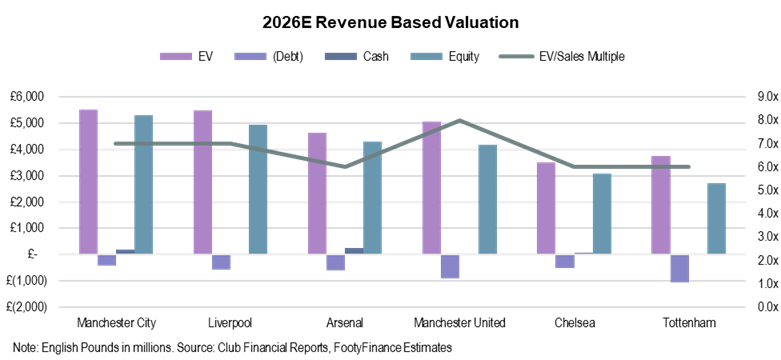
Based on the current revenue forecast of £790mm in the 2025/26 season, I value Manchester City equity at £5.3bn using a 7.0x EV/Sales multiple (in-line with ~6.0x “Big Six” average per Sportico and Forbes). I use a 7.0x EV/Sales multiple (above ~6.0x Big Six average per Sportico, Forbes, and CNBC) given Manchester City’s continued success at the upper echelon of English and European competitions in recent seasons, and subsequent impact on revenue growth. Note that despite using a higher multiple for Manchester United (8.0x), Manchester City’s valuation is ~£1.2bn higher. Manchester City also benefits from lowest debt balance amongst the Big Six.
Full summary model is detailed in the table below. I plan to make full excel access available at a later date.
Disclaimer
This report discusses valuation of Manchester City Football Club for informational purposes only and does not constitute investment advice. All investment decisions should be made at one’s own risk and/or with the advice of an investment professional.
This report presents a view only as of the date of this communication and any opinions, estimates, and assumptions expressed herein are made as of the date of this communication. The information contained may be subject to change and/or withdrawal without notice or become incorrect due to passage of time and/or as a result of legal, political, economic, and other changes. FootyFinance does not assume responsibility to notify you of such changes and/or furnish an updated report. FootyFinance does not assume responsibility for results from this model.
FootyFinance is not, by making this material available, providing legal, regulatory, tax, financial, or accounting advice to the recipient of this report or any other party. Sources for the information herein are believed to be reliable, but FootyFinance makes no representation and gives no warranty as to the completeness or accuracy of the information contained herein. Past performance is not indicative of future results. No liability is accepted by FootyFinance for any losses that may arise from any use of or reliance on the information contained herein.