
Key Message: Per my forecast, Liverpool is on track to achieve the second highest revenue in the English Premier League for the 2025/26 season at £786mm (+9% y/y), underpinning my equity valuation of £4.9bn (based on 7.0x EV/Sales multiple). Over the past decade, the club has been a perennial title contender both domestically and in Europe which has translated into financial success off the field. Within, I further detail initial 2025/26 financial forecast for Liverpool across all key KPIs (in addition to estimates for the not yet reported 2024/25 season). I plan to update estimates on a regular basis as the season progresses.
Revenue
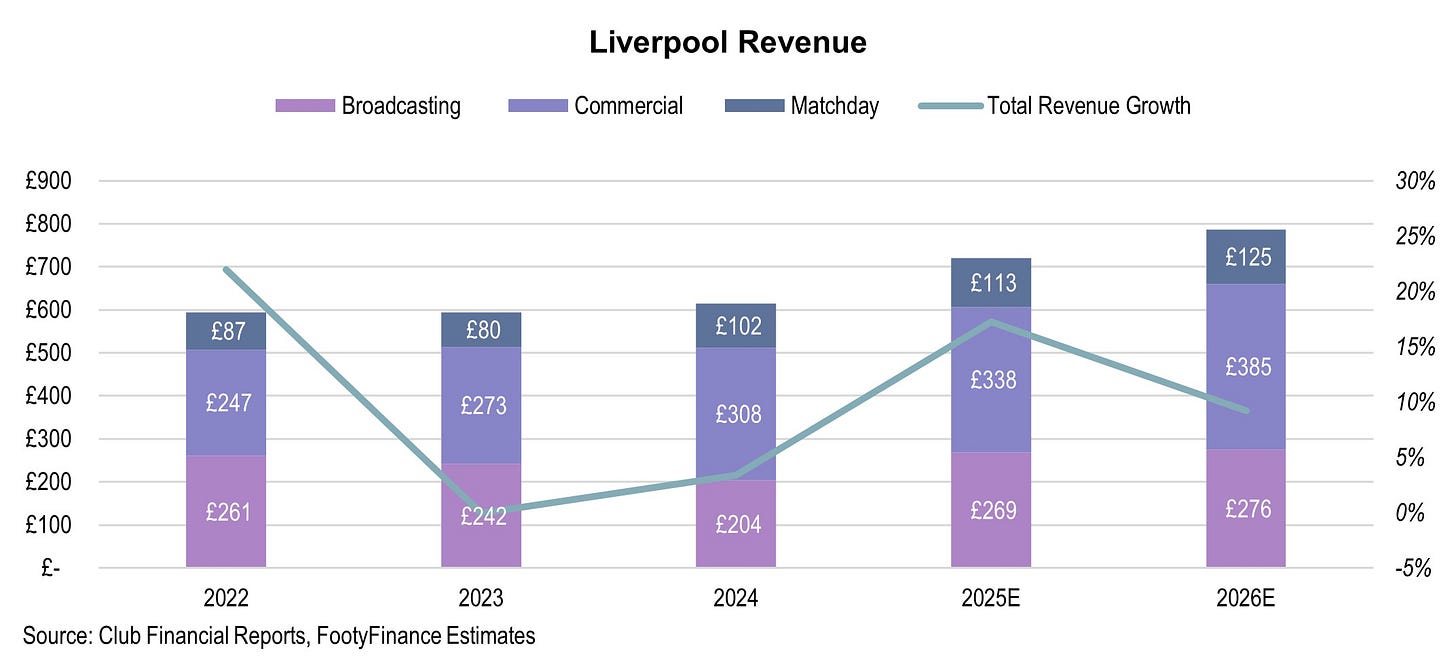
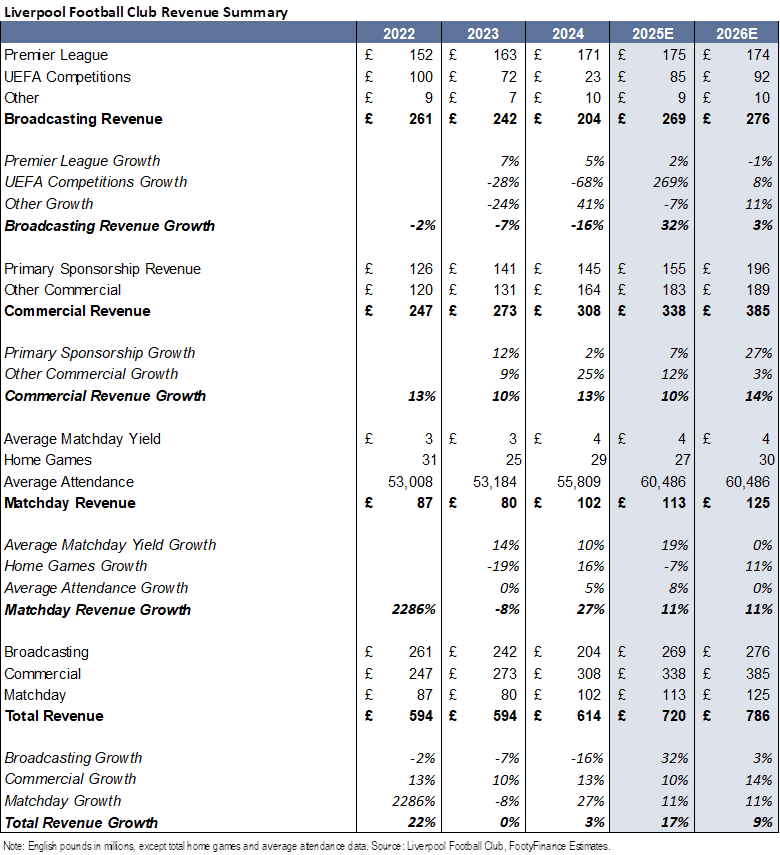
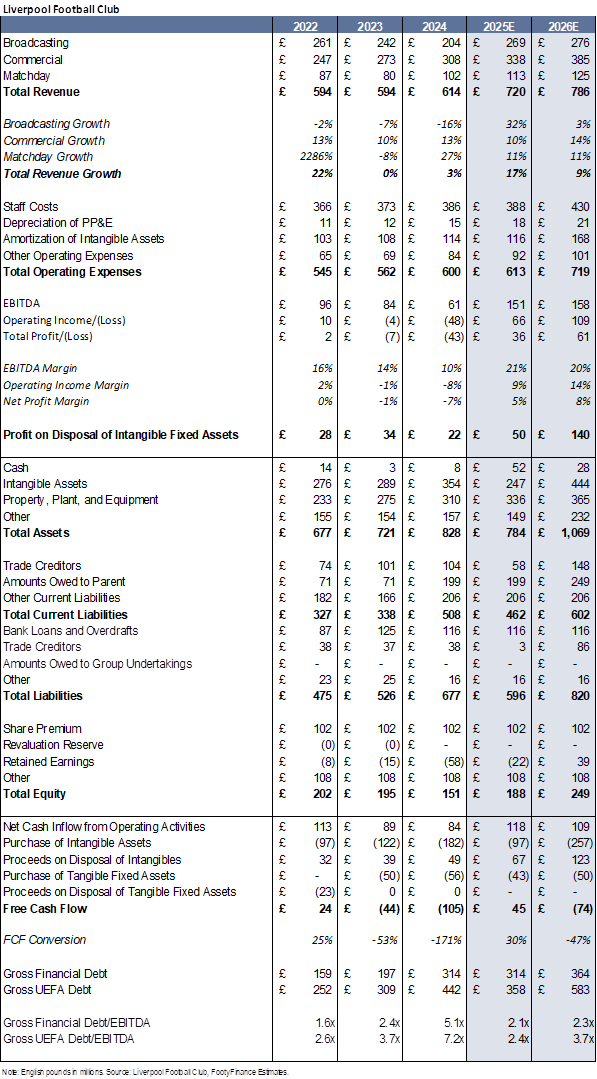
For the 2025/26 season, I forecast total revenue of £786mm (+9% y/y) with gains primarily led by Commercial (+14%) followed by Matchday (+11%) and Broadcasting (+3%).
Broadcast Revenue
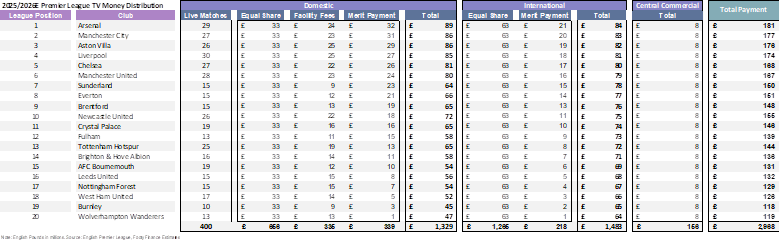
Based on current standing for a fourth place finish in the EPL, I forecast £174mm of EPL Broadcast revenue for the 2025/26 season (-1% y/y following first place finish in 2024/25 season). Note that the 2025/26 season is the first year of the EPL’s new domestic TV deal.
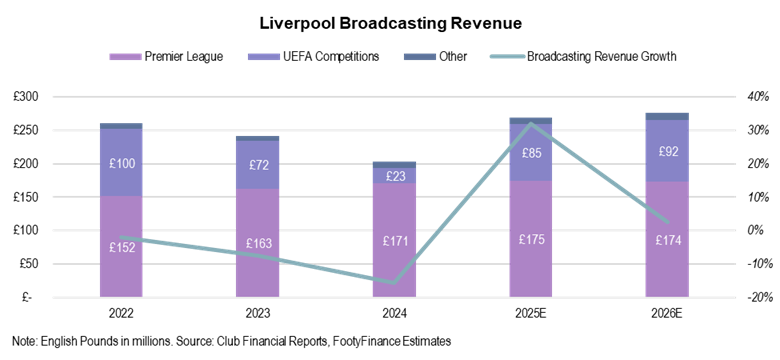
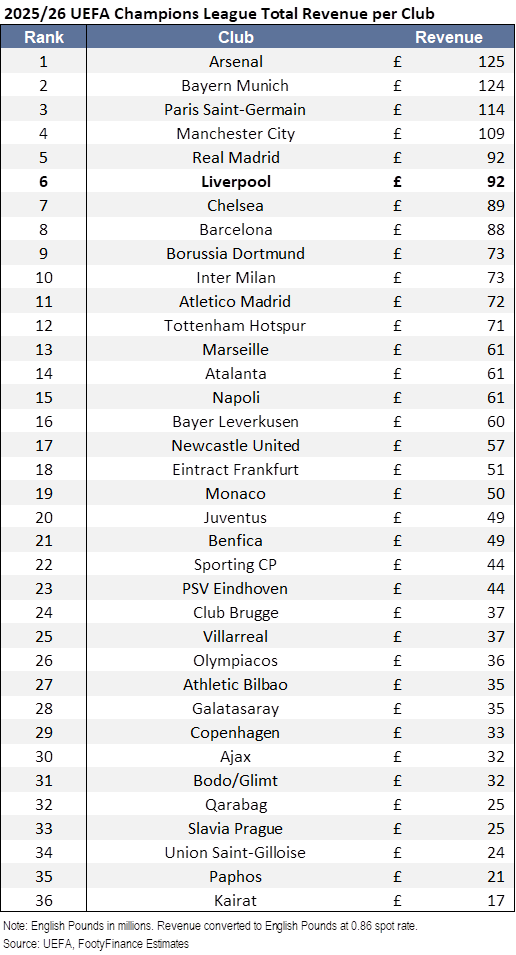
Odds for the UEFA Champions League currently value Liverpool as the sixth most likely to win the competition. For modeling purposes pre-completion of the competition, I assume sixth best odds to win as equivalent to finishing sixth in the group stage and reaching the quarter-finals of the knockout round. A quarter-final finish garners Liverpool UEFA revenue of £92mm for the 2025/26 season (+8% y/y following Champions League round of 16 exit in 2024/25)
Additionally, I model modest contribution of £10mm in revenue from the EFL Cup and FA Cup.
Commercial Revenue
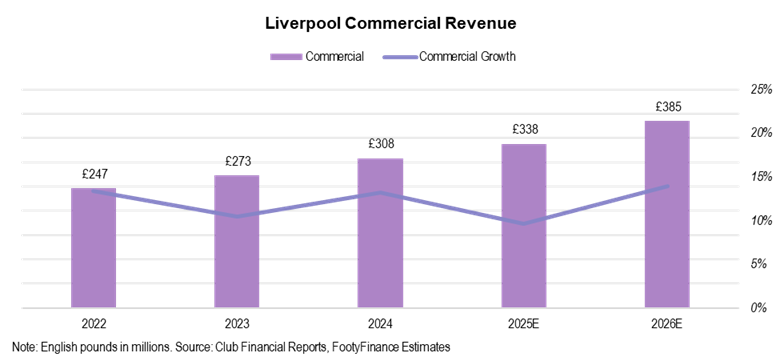
I expect Liverpool’s Commercial revenue growth to accelerate to +14% in the 2025/26 season (vs. +10% in the 2024/25 season) primarily driven by new kit deal signed with Adidas (reportedly worth >£60mm/season for the base payment vs. prior £30mm/season base fee arrangement with Nike).
Matchday Revenue
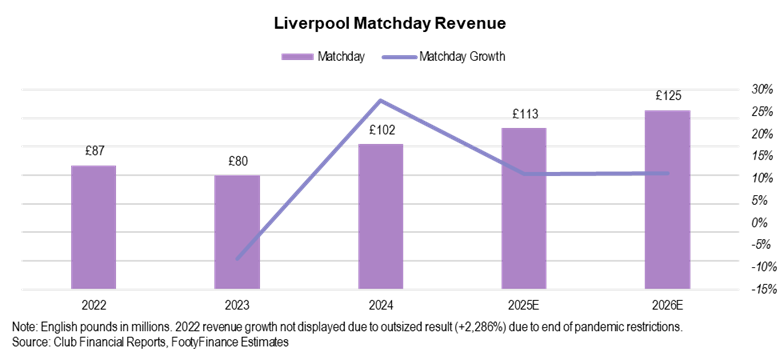
For matchday revenue, I expect Liverpool to benefit from a deeper run in the Champions League compared to the 2024/25 season. I currently model matchday revenue of £125mm for the 2025/26 season (+11% y/y) vs. £113mm in the 2024/25 season.
Full revenue summary provided in the table below.
Player Transfers
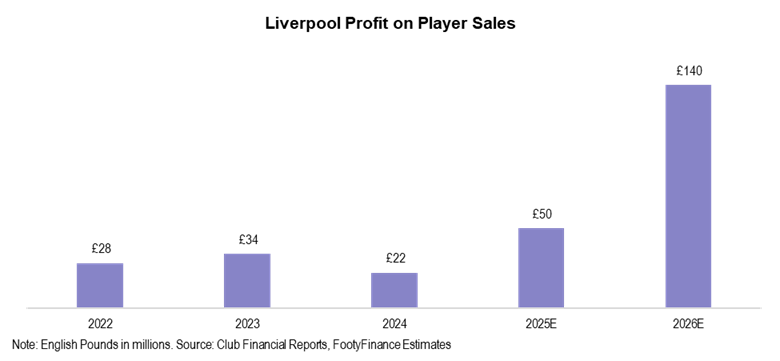
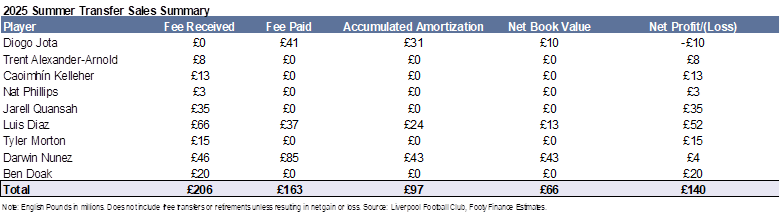
I forecast significant financial contribution from player sales in the 2025/26 season. I currently model profit on disposal of player registrations of £140mm in 2025/26 (vs. £50mm estimate for 2024/25 season and £28mm average from 2021/22 through 2023/24). I estimate outsized player sale profit vs. recent seasons is primarily driven by sales of Luis Diaz (£52mm estimated profit) and Jarell Quansah (£35mm estimated profit). Note that 2025/26 season estimates do not factor in potential winter transfers (assumed £0mm profit until window closes).
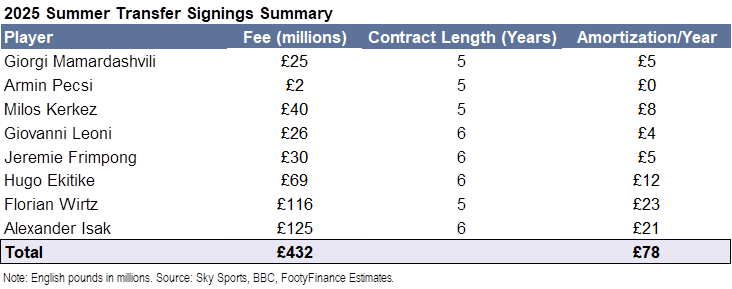
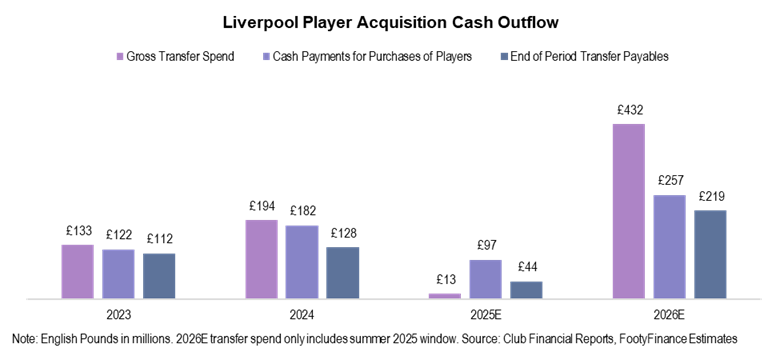
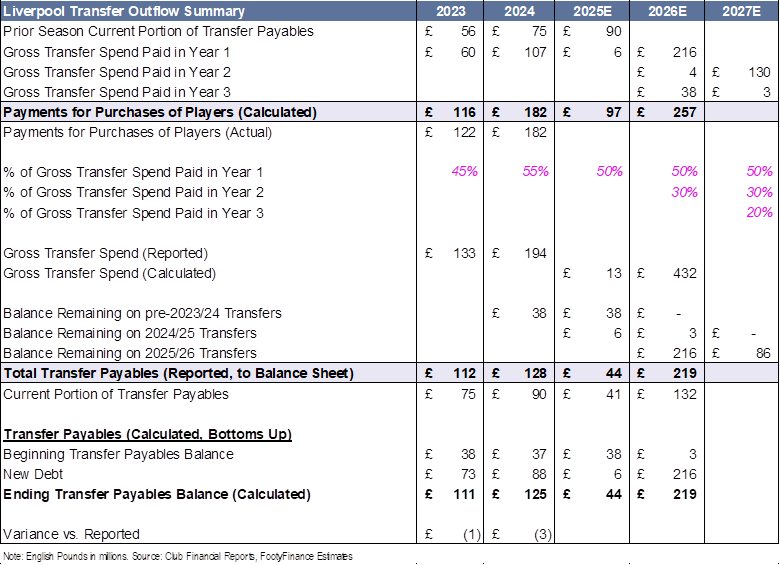
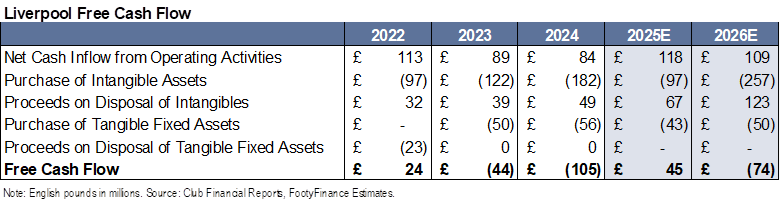
From a cash outflow perspective, I estimate gross transfer spend of £432mm in the 2025 summer window with cash outflow of £257mm for the 2025/26 season. Note that because cash payments/receipts for player purchases/sales are typically paid/received through installment plans over multiple seasons, cash outflow/inflow amounts differ from gross transfer spend/income each season.
To calculate cash outflow for the first forecast year (2024/25 in the case of Liverpool), I take the prior season’s reported, current transfer payables and add that amount to an estimated % of gross transfer spend paid (in cash) for the 2024/25 season (I align this % with historical trend for forecast years). To calculate gross transfer spend in the forecast years, I sum up all press reported values for transfers in each season.
To calculate cash outflow for the second forecast year (2025/26 in the case of Liverpool), I assume a three-year installment plan for transfer payments given there is not a current transfer payable amount reported yet for the 2024/25 season. Year one transfer cash payments reflect 50% of 2025/26 season gross transfer spend; year two payments reflect 30% of 2024/25 season gross transfer spend; and year three payments reflect the non-current portion of 2023/24 transfer payables (current portion will be paid in the 2024/25 season with remainder assumed to be paid ~three seasons later in 2025/26). A full guide to my transfer cash flow and debt forecasting can be found here.
The £257mm cash outflow estimate for the 2025/26 season includes £216mm related to 2025/26 transfers, £4mm for 2024/25 transfers, and £38mm for 2023/24 transfers. Like player sale profit, I do not forecast potential winter transfer spend due to significant variability between periods.
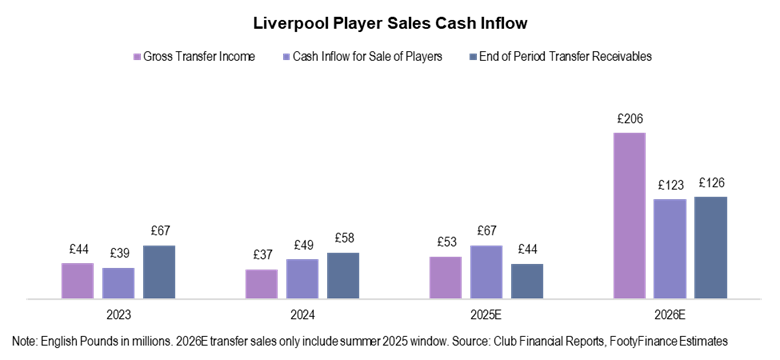
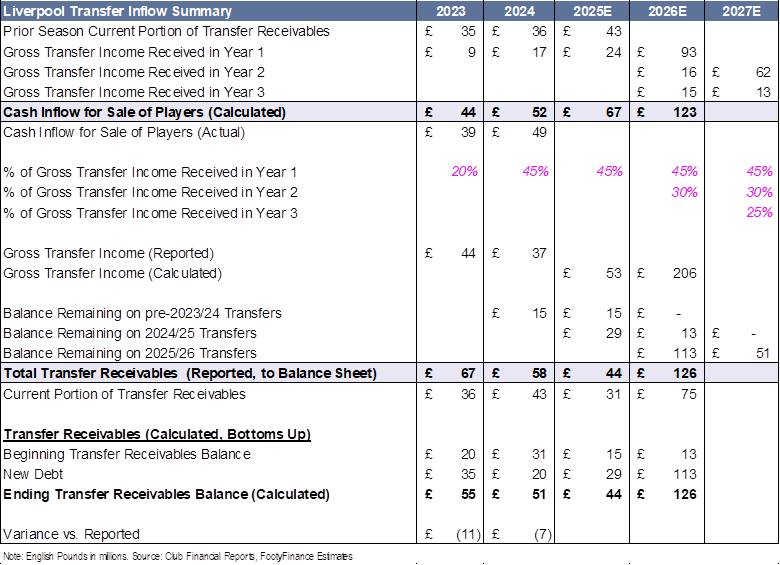
From a cash inflow perspective, I estimate gross transfer income of £206mm in the 2025 summer window with cash inflow of £123mm expected for the 2025/26 season. Forecasting for transfer cash inflow follows the same methodology as transfer cash outflows.
To calculate cash inflow for the first forecast year, I take the prior season’s reported, current transfer receivables and add that amount to an estimated % of gross transfer income received (in cash) for the 2024/25 season (I align this % with historical trend for forecast years). To calculate gross transfer income in the forecast years, I sum up all press reported values for transfers in each season.
To calculate cash inflow for the second forecast year, I assume a three-year installment plan for transfer sales given there is not a current transfer receivable amount reported yet for the 2024/25 season. Year one transfer cash inflow reflects 45% of 2025/26 season gross transfer income; year two proceeds reflect 30% of 2024/25 season gross transfer income; and year three payments reflect the non-current portion of 2023/24 transfer receivables (current portion will be received in the 2024/25 season with remainder assumed to be received ~three seasons later in 2025/26).
The £123mm cash inflow estimate for the 2025/26 season includes £93mm related to 2025/26 transfer sales, £16mm from 2024/25 transfers, and £15mm from 2023/24 transfers.
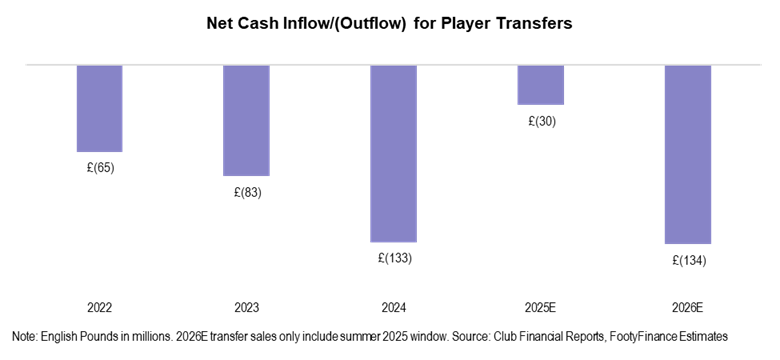
Full transfer cash outflow and inflow summary is provided in the tables below. Note that the 2027E forecasting year is used solely for calculating current transfer payable/receivable amounts for the 2026E financial year.
Expenses
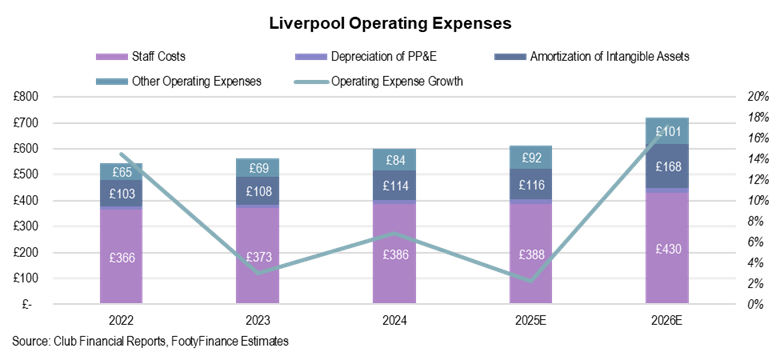
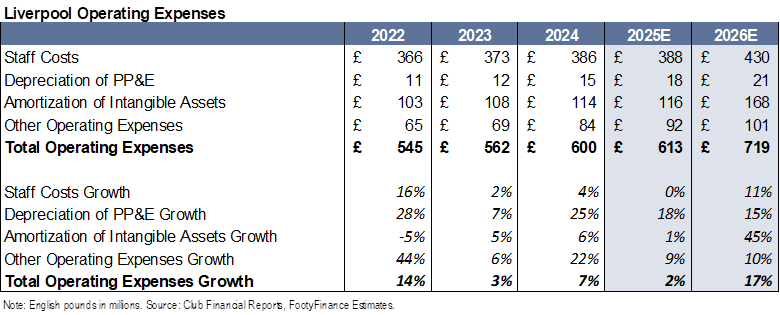
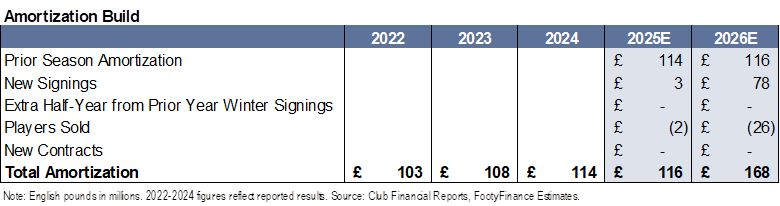
I expect Liverpool’s expense growth to accelerate in the 2025/26 season primarily driven by new player signings with Staff Costs +11% y/y and Amortization of Registrations +45% y/y.
Profitability
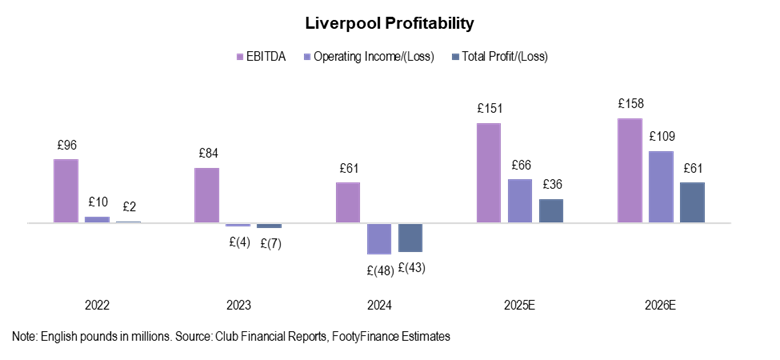
I forecast significant profitability improvement for Liverpool in the 2025/26 season. Note that Liverpool operating income/(loss) includes contributions from player sale profits. When comparing to other clubs, I remove profit from player registrations from operating income/(loss). I primarily focus on EBITDA as the key profitability metric.
EBITDA
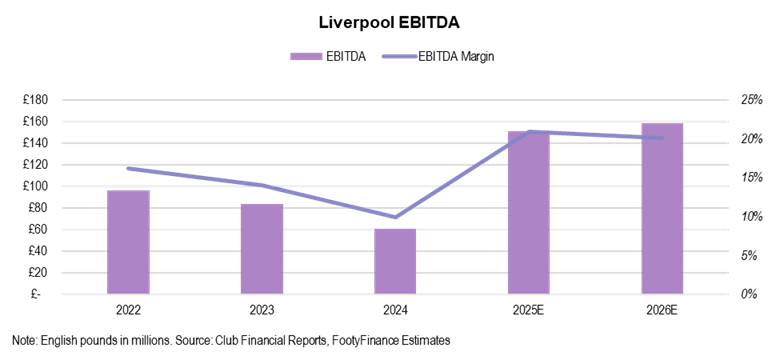
I expect EBITDA margin to slightly decline in the 2025/26 season to 20.1% (vs. 20.9% estimate for 2024/25 season). Compared to the average EBITDA margin of 13.4% for the 2021/22 through 2023/24 seasons, Liverpool continues to show strong profitability improvement.
Free Cash Flow
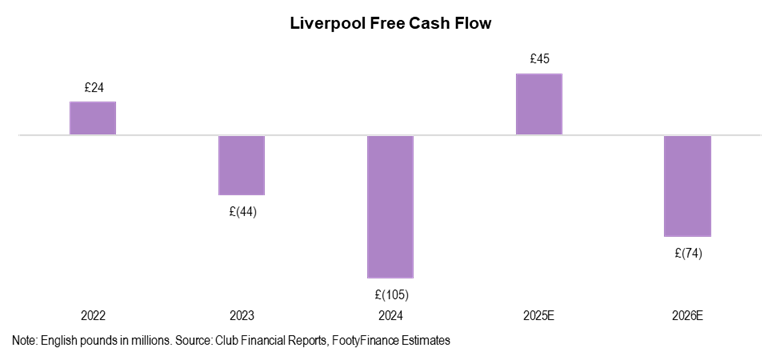
I expect Free Cash Flow (FCF) to turn negative in the 2025/26 season following positive inflow in the 2024/25 season, primarily driven by outsized player purchases in the summer 2025 window.
Debt
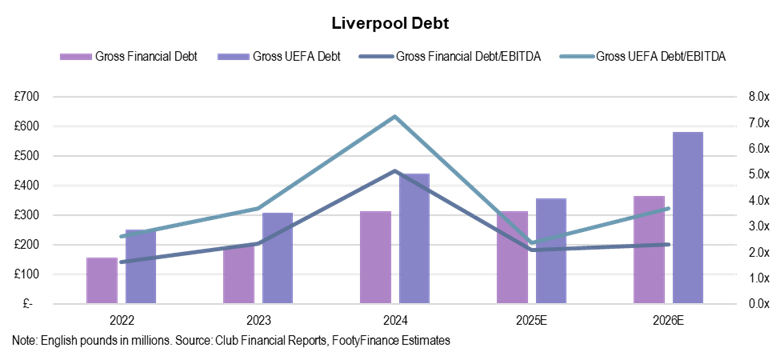
I forecast gross financial debt of £364mm in the 2025/26 season (slightly higher than most recently reported figure of £314mm in the 2023/24 season). I expect significant gross UEFA debt increase from £358mm estimated for the 2024/25 season to £583mm in 2025/26 driven by the high volume 2025 summer transfer window. Note that Financial Debt includes traditional debt instruments such as owner debt and external loans. UEFA debt adds transfer debt on top of the financial debt figure. Despite Liverpool’s projected debt increase, leverage ratios remain below estimated “Big Six” peer average as EBITDA gains help to offset debt increases.
Valuation
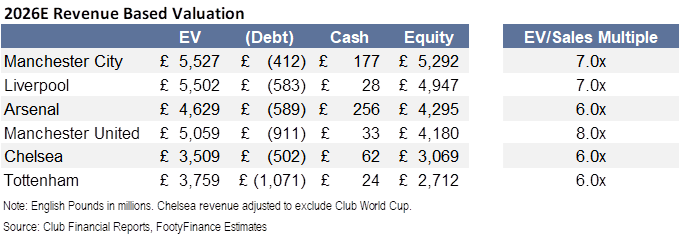
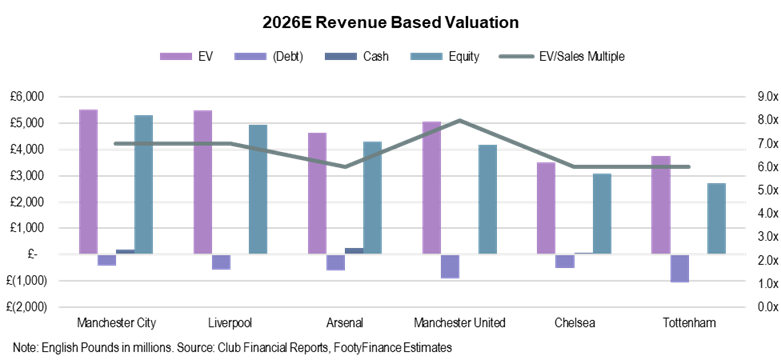
Based on my current revenue forecast of £786mm for the 2025/26 season, I value total Liverpool equity at £4.9bn using a 7.0x EV/Sales multiple. I believe Liverpool’s heavy spend in the summer 2025 transfer window (and subsequent assumption for strong increase in transfer debt), has ~£100-200mm headwind to current valuation. My valuation places Liverpool second only to Manchester City. I use 7.0x EV/Sales multiple (above ~6.0x “Big Six” average per Sportico and Forbes) given Liverpool’s continued success at the upper echelon of English and European competitions in recent seasons, and subsequent impact on revenue growth. Note that despite higher multiple for Manchester United (8.0x), Liverpool’s valuation is ~£750mm higher.
Summary Model
Full summary model detailed in the tables below. I plan to make full excel access available at a later date.
Disclaimer
This report discusses valuation of Liverpool Football Club for informational purposes only and does not constitute investment advice. All investment decisions should be made at one’s own risk and/or with the advice of an investment professional.
This report presents a view only as of the date of this communication and any opinions, estimates, and assumptions expressed herein are made as of the date of this communication. The information contained may be subject to change and/or withdrawal without notice or become incorrect due to passage of time and/or as a result of legal, political, economic, and other changes. FootyFinance does not assume responsibility to notify you of such changes and/or furnish an updated report. FootyFinance does not assume responsibility for results from this model.
FootyFinance is not, by making this material available, providing legal, regulatory, tax, financial, or accounting advice to the recipient of this report or any other party. Sources for the information herein are believed to be reliable, but FootyFinance makes no representation and gives no warranty as to the completeness or accuracy of the information contained herein. Past performance is not indicative of future results. No liability is accepted by FootyFinance for any losses that may arise from any use of or reliance on the information contained herein.