
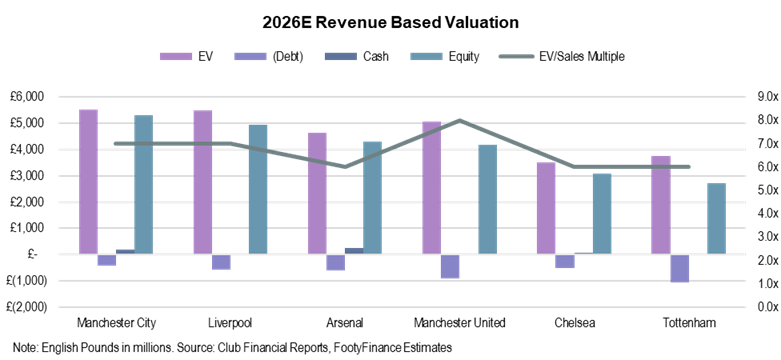
Key Message: Per my forecast, Chelsea is on track to achieve the fourth highest revenue in the English Premier League for the 2025/26 season with £653mm (+38% y/y), underpinning my equity valuation of £3.1bn (based on a 6.0x EV/Sales multiple). I expect Broadcasting revenue to be the largest contributor to accelerating top-line growth in the 2025/26 season driven by 1) return of Champions League football, and 2) high payout from the club’s summer 2025 Club World Cup championship. While Chelsea’s improved on-field performance in recent seasons is leading to a rebound in top-line results, the club’s high transfer spend and commercial revenue missteps currently limit ability to earn a premium valuation multiple. Within, I further detail initial 2025/26 financial forecast for Chelsea across all key KPIs in addition to estimates for the not yet reported 2024/25 season. I plan to update estimates on a regular basis as the season progresses.
Revenue
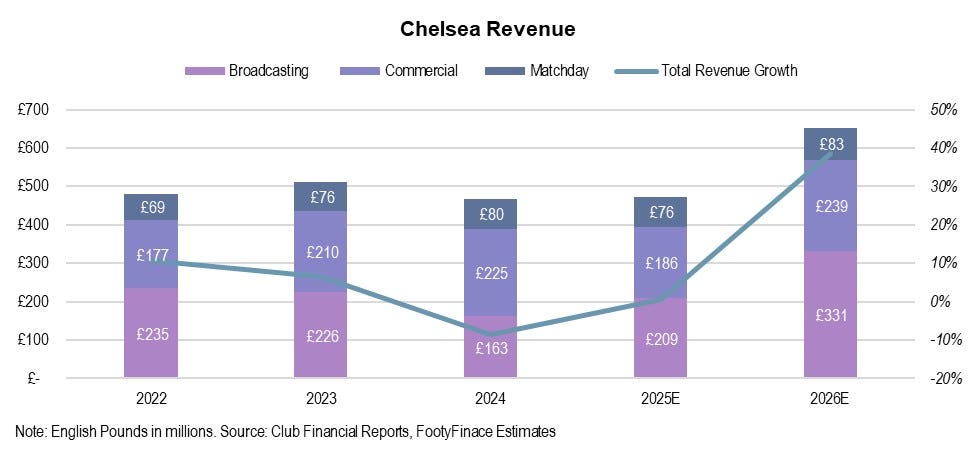
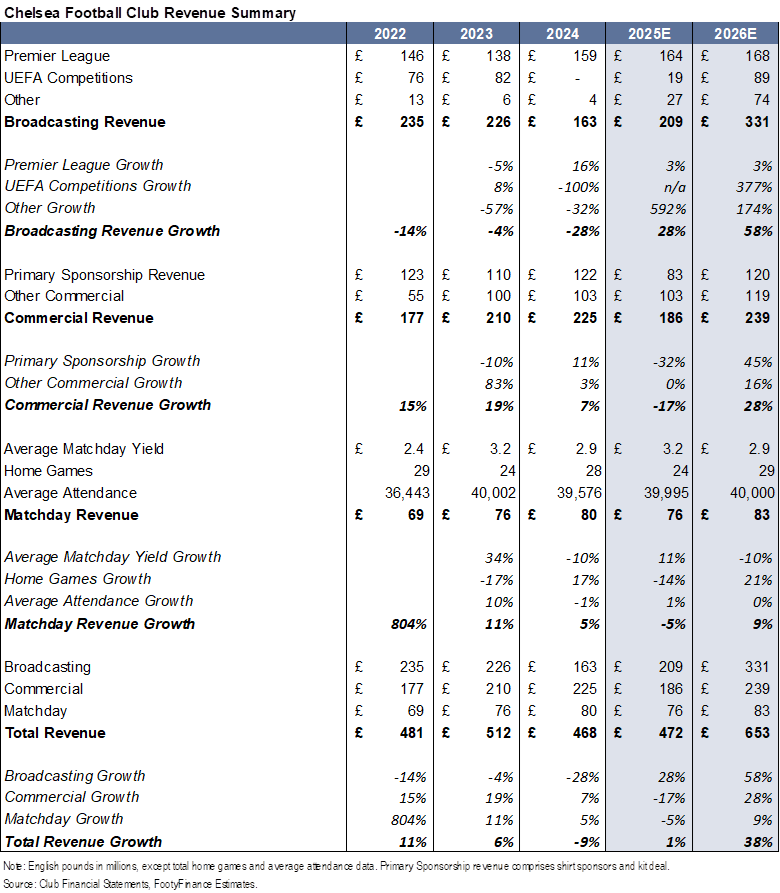
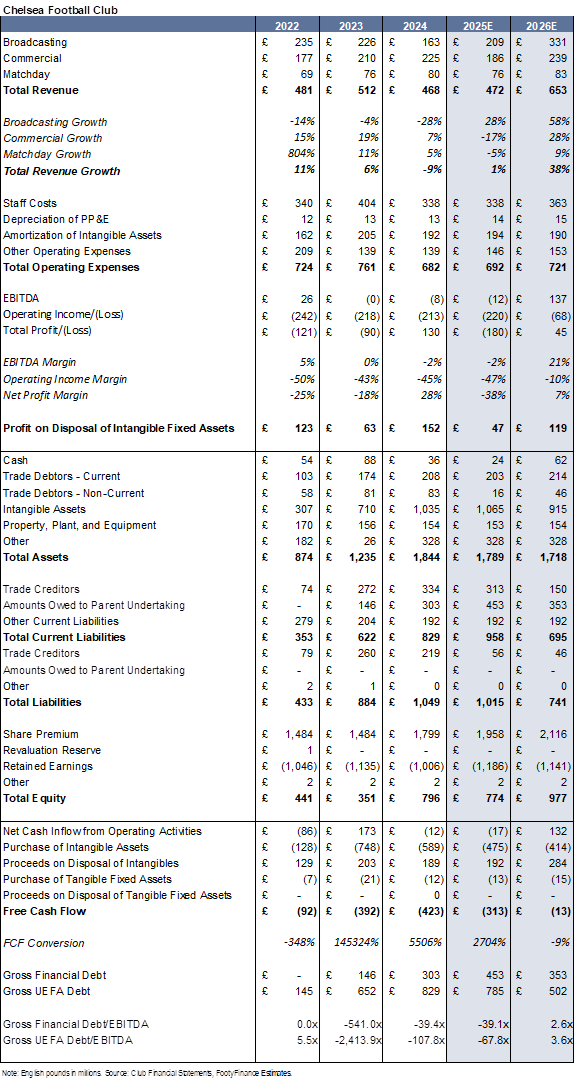
For the 2025/26 season I forecast total revenue of £653mm (+38% y/y) with gains primarily led by Broadcasting (+58%) followed by Commercial (+28%) and Matchday (+9%). I expect high payout from the summer 2025 Club World Cup championship, return of Champions League football, and new shirt sponsorship agreements (following majority of last season without a front of shirt sponsor) to drive accelerated top-line growth in the 2025/26 season.
Broadcast Revenue
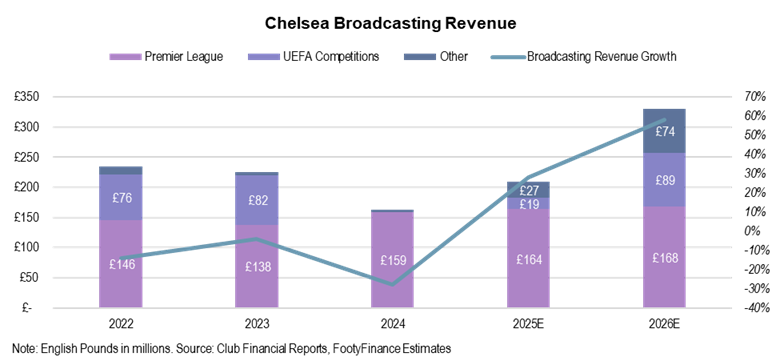
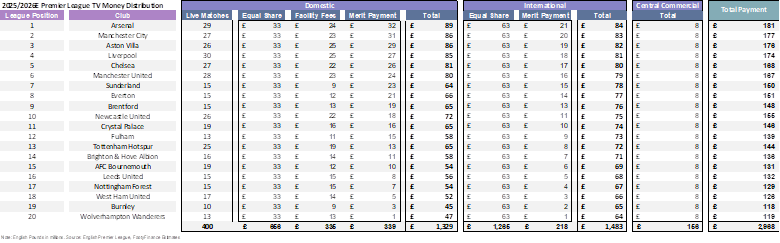
Based on current standing for a fifth place finish in the EPL, I forecast £168mm of EPL Broadcast revenue for the 2025/26 season (+3% y/y following fourth place finish in 2024/25 season).
I estimate participation in the 2025 Club World Cup had an ~£89mm tailwind to Broadcasting Revenue split across both the 2024/25 and 2025/26 seasons. I model revenue payout allocation between the two seasons based on when the match was played. Payouts corresponding to June games are allocated to the 2024/25 financial year with payouts for July games allocated to the 2025/26 financial year. I prorated the guaranteed payment of £21mm based on number of games in each month (4 in June, 3 in July). Absent benefit from the Club World Cup, I believe 2025/26 Broadcasting revenue would still increase significantly (+40% y/y vs. +58% with Club World Cup benefit).
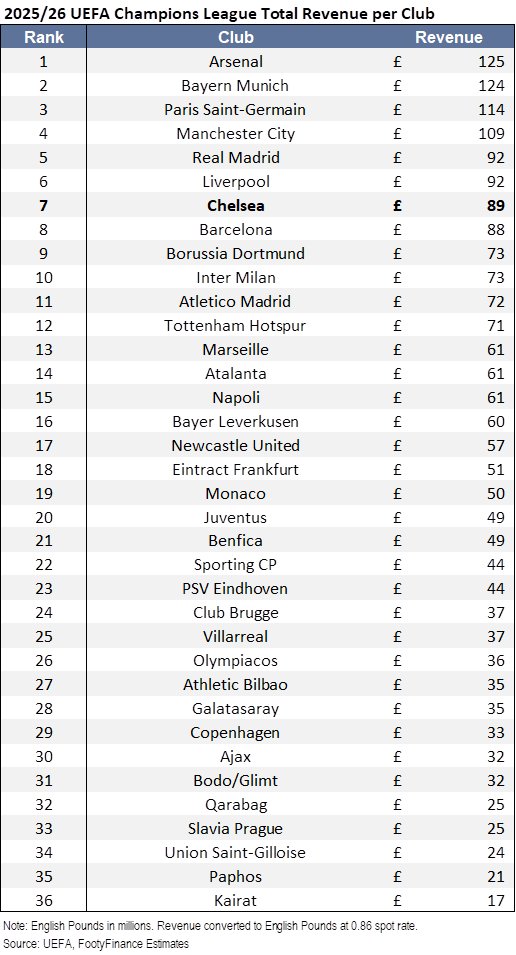
Odds for the UEFA Champions League currently value Chelsea as the seventh most likely to win the competition. For purposes of my model pre-completion of the competition, I assume seventh best odds to win as equivalent to exiting the competition in the quarter-finals. Exiting the Champions League in the quarter-finals garners UEFA revenue of £89mm for the 2025/26 season (+377% y/y vs. prior season payout from UEFA Conference League win).
Additionally, I model modest contribution of £6mm in revenue from the EFL Cup and FA Cup for the 2025/26 season.
Commercial Revenue
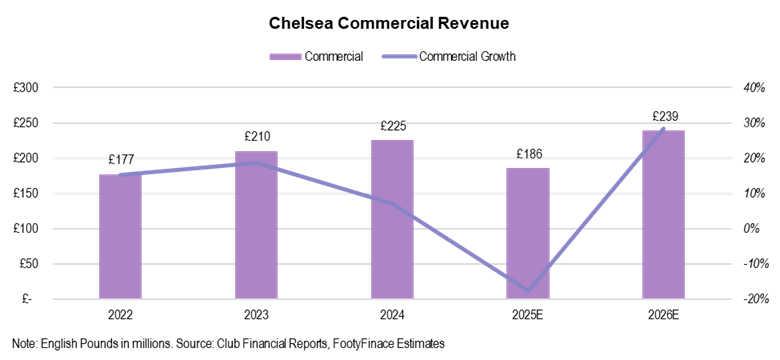
I forecast Commercial revenue growth of +28% in the 2025/26 season (vs. -17% estimated for the 2024/25 season). Gains are primarily driven by new shirt sponsors following majority of last season without a main shirt sponsor. Although no official front of shirt sponsorship has yet to materialize for the 2025/26 season, I currently model £30mm of revenue contribution as negotiations are ongoing. Prior deals with Infinite Athlete (2023/24 season) and Three (2022/23 season) were worth a reported £40mm per season. New sleeve partnership with FPT provides additional contribution (reportedly £18mm).
Matchday Revenue
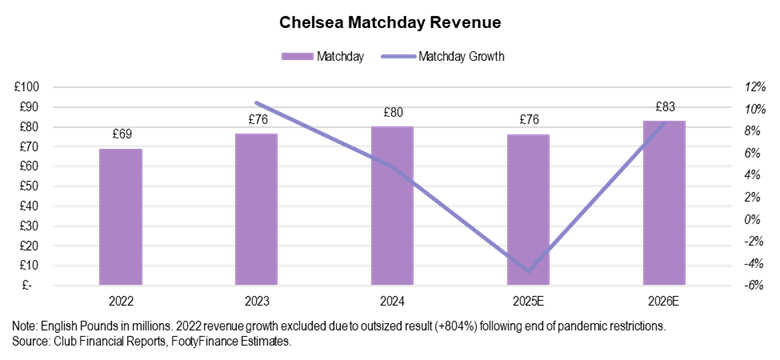
For Matchday revenue, I expect revenue growth of +9% y/y to £83mm (vs. -5% y/y estimated in 2024/25). I believe the club will see a modest bump from return of Champions League football to Stamford Bridge (vs. Conference League in prior year).
Full revenue summary is provided in the table below.
Player Transfers
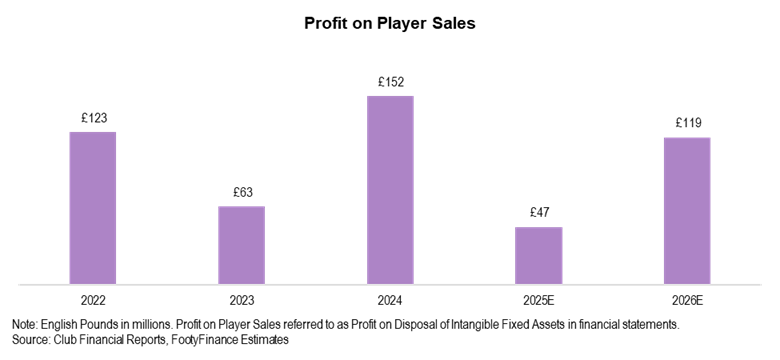
I forecast significant contribution from player sales in the 2025/26 season with profit on disposal of player registrations of £119mm (vs. estimated £47mm profit for 2024/25 season and £113mm average from 2021/22 through 2023/24). Note that 2025/26 season estimates do not factor in potential winter transfers (assumed £0mm profit until official transfers are completed).
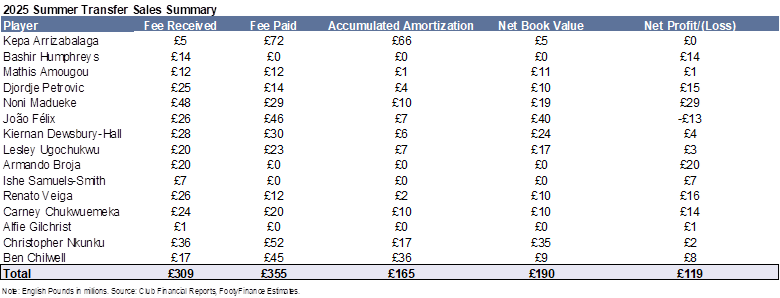
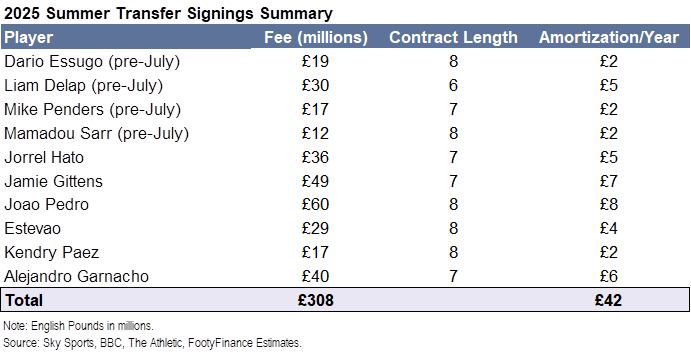
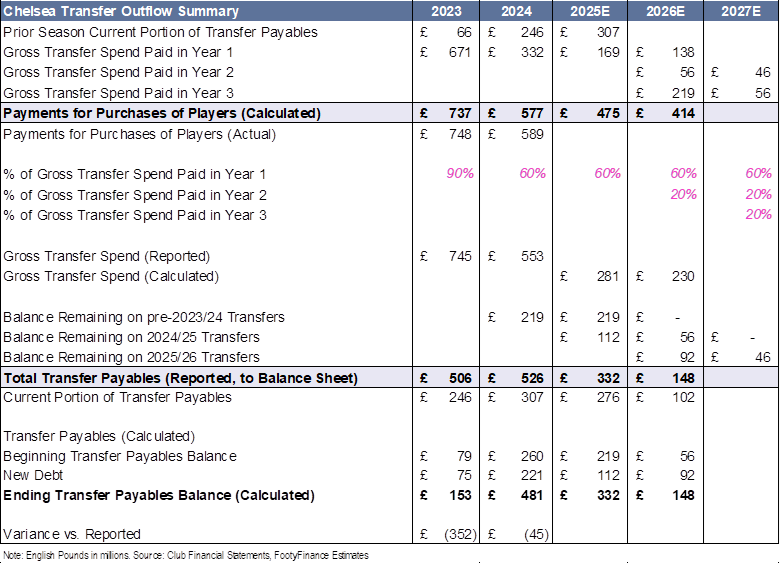
From a cash outflow perspective, I estimate gross transfer spend of £308mm in the 2025 summer window with cash outflow of £414mm for the 2025/26 season. Note that because Chelsea has a financial year end of June 30, any signings or sales made prior to July are included in the 2024/25 season results. Therefore, of this £308mm summer 2025 gross transfer spend, I estimate £230mm will be included in the 2025/26 financial year with the remainder in 2024/25. Summer 2025 signings included in the 2024/25 financial year are distinguished by “Pre-July” in the table below.
Because cash payments/receipts for player purchases/sales are typically paid/received through installment plans over multiple seasons, cash outflow/inflow amounts differ from gross transfer spend/income each season.
To calculate cash outflow for the first forecast year (2024/25 in the case of Chelsea), I take the prior season’s reported, current transfer payables and add that amount to an estimated % of gross transfer spend paid (in cash) for the 2024/25 season (I align this % with historical trend for forecast years). To calculate gross transfer spend in the forecast years, I sum up all press reported values for transfers in each season.
To calculate cash outflow for the second forecast year (2025/26 in the case of Chelsea), I assume a three-year installment plan for transfer payments given there is not a current transfer payable amount reported yet for the 2024/25 season. Year one transfer cash payments reflect 60% of 2025/26 season gross transfer spend; year two payments reflect 20% of 2024/25 season gross transfer spend; and year three payments reflect the non-current portion of 2023/24 transfer payables (current portion will be paid in the 2024/25 season with remainder assumed to be paid ~three seasons later in 2025/26). A full guide to my transfer cash flow and debt forecasting can be found here.
The £414mm cash outflow estimate for the 2025/26 season includes £138mm related to 2025/26 transfer sales, £56mm from 2024/25 transfers, and £219mm from 2023/24 transfers. Like player sale profit, I do not forecast potential winter transfer spend due to significant variability between periods.
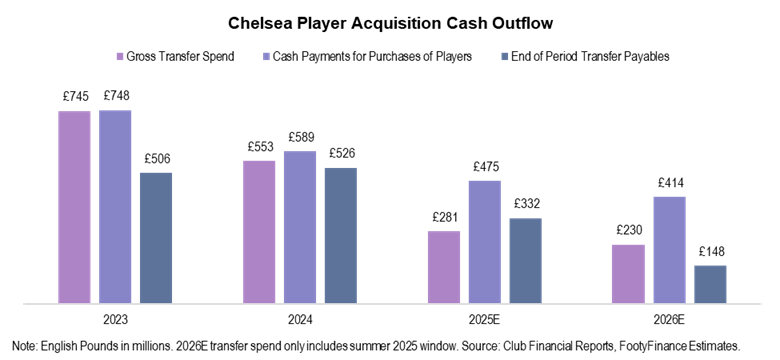
Note: Chelsea does not directly disclose transfer payables and transfer receivables like other Big Six clubs. Historical estimates used to inform my forward-looking forecast are calculated as 95% of reported trade creditors (for transfer payables) and 75% of trade debtors (for transfer receivables).
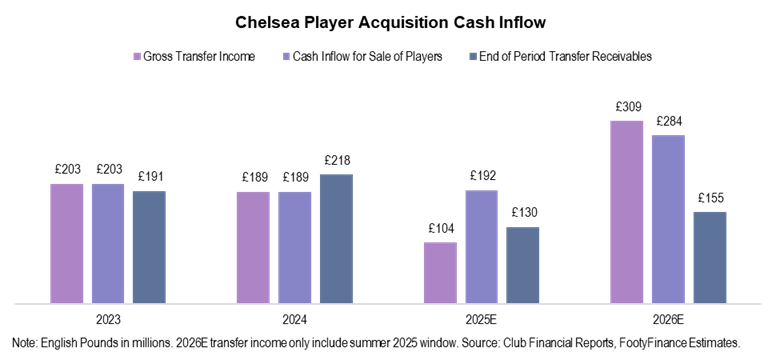
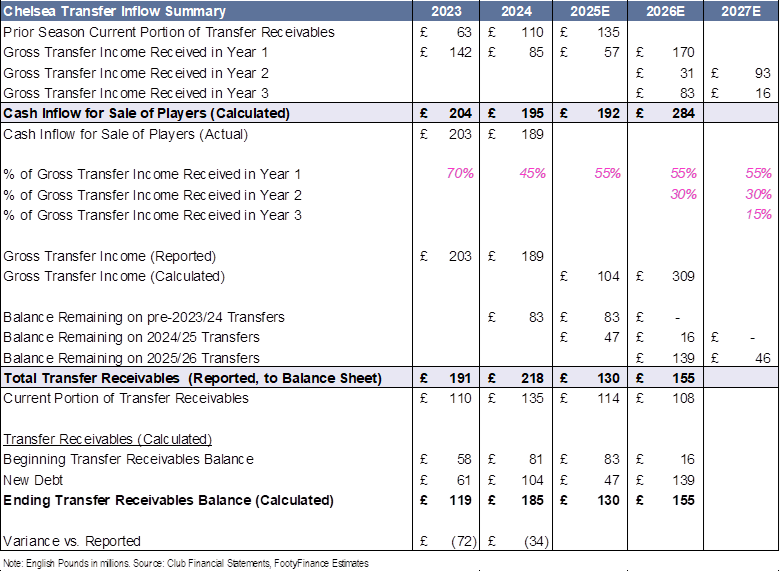
From a cash inflow perspective, I estimate gross transfer income of £309mm in the summer 2025 window with cash inflow of £284mm expected for the 2025/26 season. Forecasting for transfer cash inflow follows the same methodology as transfer cash outflows. No major sales occurred prior to June 30 and thus all summer 2025 transactions are included in the 2025/26 financial year.
To calculate cash inflow for the first forecast year, I take the prior season’s reported, current transfer receivables and add that amount to an estimated % of gross transfer income received (in cash) for the 2024/25 season (I align this % with historical trend for forecast years). To calculate gross transfer income in the forecast years, I sum up all press reported values for transfers in each season.
To calculate cash inflow for the second forecast year, I assume a three-year installment plan for transfer sales given there is not a current transfer receivable amount reported yet for the 2024/25 season. Year one transfer cash inflow reflects 55% of 2025/26 season gross transfer income; year two proceeds reflect 30% of 2024/25 season gross transfer income; and year three payments reflect the non-current portion of 2023/24 transfer receivables (current portion will be received in the 2024/25 season with remainder assumed to be received ~three seasons later in 2025/26).
The £284mm cash inflow estimate for the 2025/26 season includes £170mm related to 2025/26 transfer sales, £31mm from 2024/25 transfers, and £83mm from 2023/24 transfers.
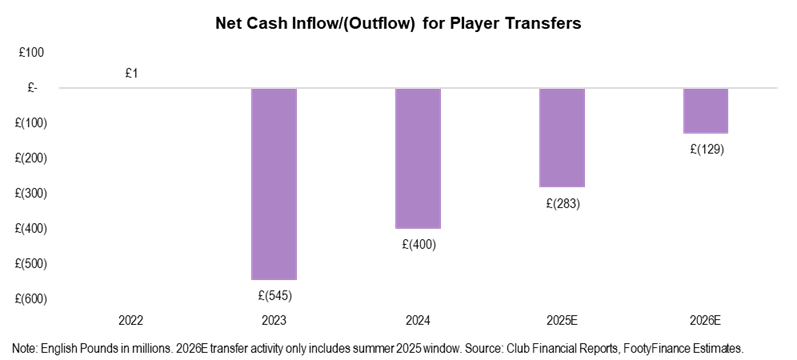
Full transfer cash outflow and inflow summary is provided in the tables below. Note that the 2027E forecasting year is used solely for calculating current transfer payable/receivable amounts for the 2026E financial year.
Expenses
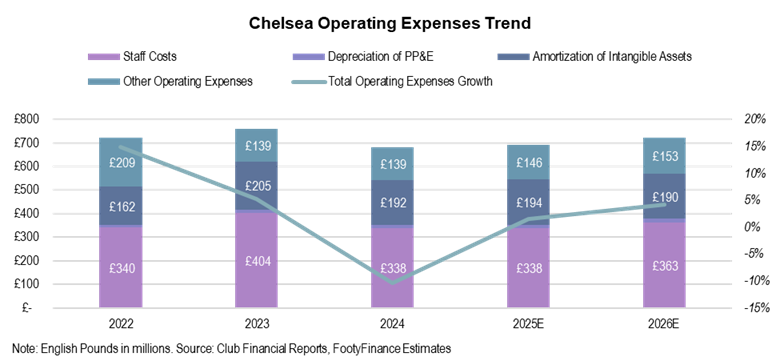
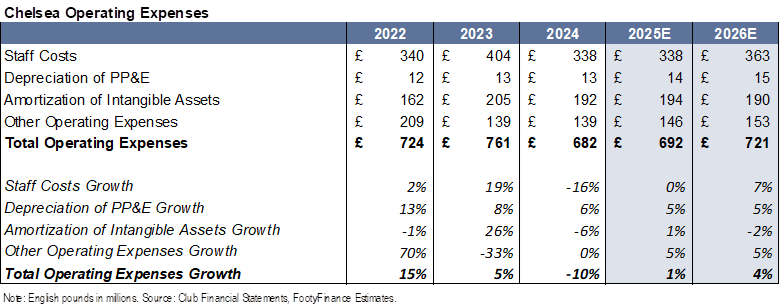
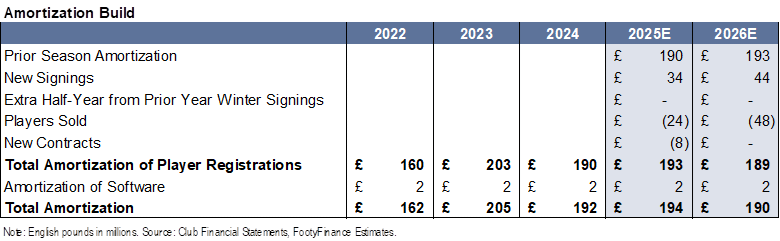
I expect Chelsea’s expense growth to slightly accelerate in the 2025/26 season (+4% y/y) primarily driven by wage growth with Staff Costs +7% y/y.
Profitability
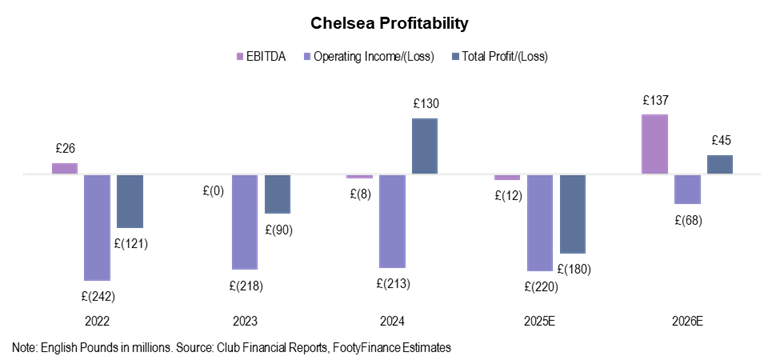
I forecast significant EBITDA improvement for Chelsea in the 2025/26 season largely driven by sponsorship revenue growth and incremental Broadcasting revenue from the Club World Cup. I expect operating income to remain negative (although improved y/y) with positive net income primarily driven by profit on player sales.
EBITDA
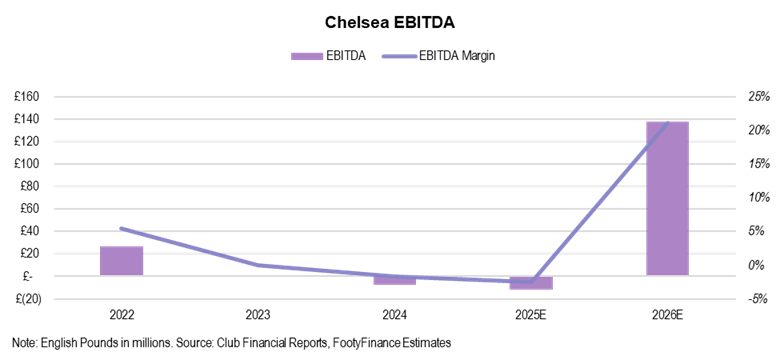
I expect EBITDA margin to turn positive in the 2025/26 season at 19% (vs. -2% estimate in 2024/25 season and 1% average for the 2021/22 through 2023/24 seasons). Note Club World Cup tailwind providing incremental uplift to margins (-7% EBITDA margin in 2024/25 without Club World Cup, 12% EBITDA margin in 2025/26 without Club World Cup).
Free Cash Flow
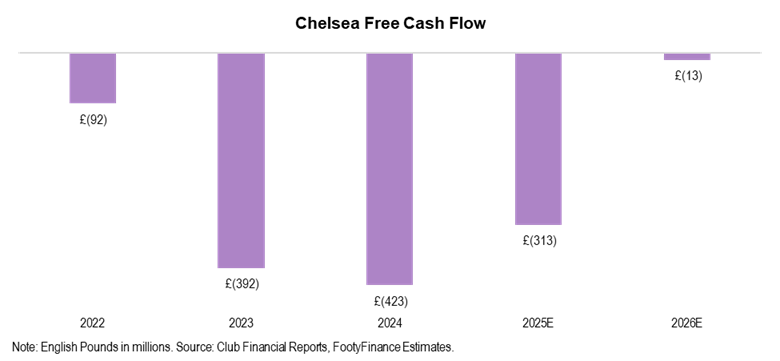
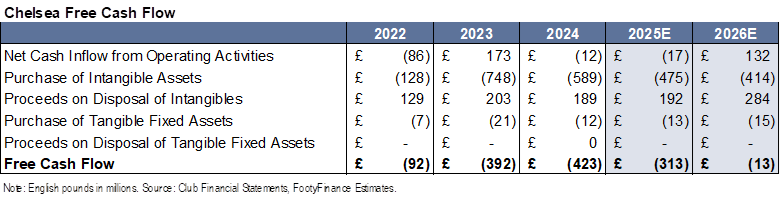
I forecast Free Cash Flow (FCF) of -£13mm in the 2025/26 season representing significant improvement vs. recent years.
Debt
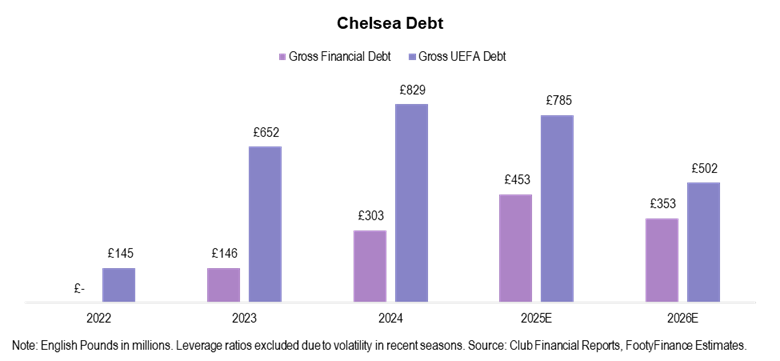
I forecast gross financial debt of £353mm in the 2025/26 season (up from most recently reported figure of £303mm in the 2023/24 season). I expect gross UEFA debt to decrease from an estimated £785mm in the 2024/25 season to £502mm in 2025/26 driven by a lower volume summer 2025 transfer window. My 2025/26 UEFA debt estimate compares to most recently reported figure of £829mm in the 2023/24 season. Note that Financial Debt includes traditional debt instruments such as owner debt and external loans. UEFA debt adds transfer debt on top of the financial debt figure.
While I have provided leverage ratios in other Big Six club reports, I excluded for Chelsea due to large, negative ratio amounts in the 2022/23, 2023/24, and 2024/25 seasons making for difficult comparisons and scaling issues.
Valuation
Based on my current revenue forecast of £653mm for the 2025/26 season, I value Chelsea equity at £3.1bn using a 6.0x EV/Sales multiple (in-line with ~6.0x “Big Six” average per Sportico, Forbes, and CNBC). For purposes of the valuation, I excluded 2026E revenue contribution from the Club World Cup (£68mm) to allow for comparison of core operating performance across all clubs. While Chelsea is demonstrating improved on-field performance in recent seasons, I believe the club’s high transfer spend and commercial revenue missteps limit ability to earn a premium multiple.
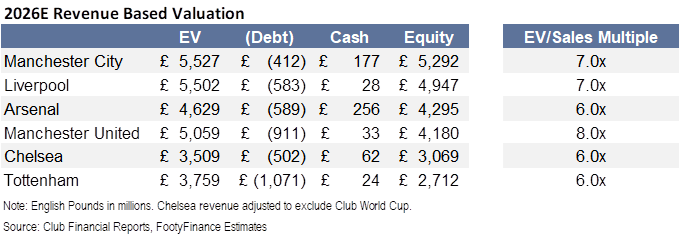
Full summary model detailed in the table below. I plan to make full excel access available at a later date.
Disclaimer
This report discusses valuation of Chelsea Football Club for informational purposes only and does not constitute investment advice. All investment decisions should be made at one’s own risk and/or with the advice of an investment professional.
This report presents a view only as of the date of this communication and any opinions, estimates, and assumptions expressed herein are made as of the date of this communication. The information contained may be subject to change and/or withdrawal without notice or become incorrect due to passage of time and/or as a result of legal, political, economic, and other changes. FootyFinance does not assume responsibility to notify you of such changes and/or furnish an updated report. FootyFinance does not assume responsibility for results from this model.
FootyFinance is not, by making this material available, providing legal, regulatory, tax, financial, or accounting advice to the recipient of this report or any other party. Sources for the information herein are believed to be reliable, but FootyFinance makes no representation and gives no warranty as to the completeness or accuracy of the information contained herein. Past performance is not indicative of future results. No liability is accepted by FootyFinance for any losses that may arise from any use of or reliance on the information contained herein.